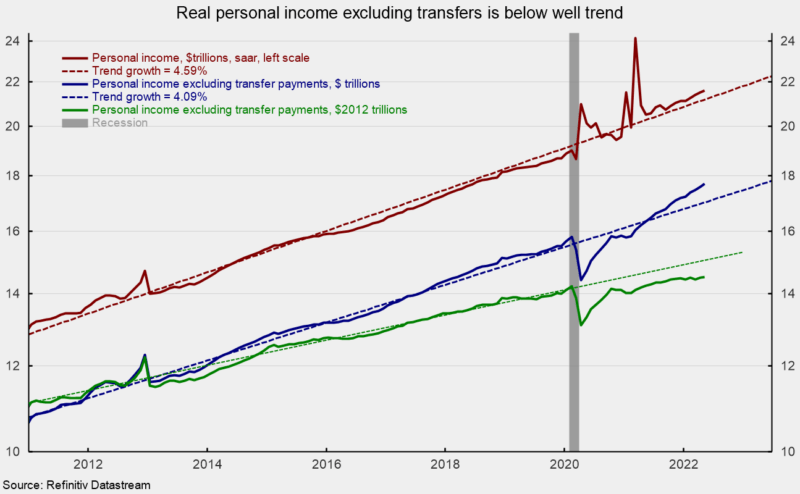
Personal income rose 0.5 percent in May, according to data from the Bureau of Economic Analysis (see first chart). Over the past two and a half years, personal income data have been sharply distorted by lockdown policies which caused massive layoffs, and government stimulus programs that sent transfer payments skyrocketing. As distortions fade, personal income is moving closer to trend growth (see first chart).
Excluding personal transfer payments, personal income rose 0.7 percent in May and is up 8.3 percent over the latest 12-month period. It is also significantly above the recent trend line (see first chart).
In real terms (adjusting for price changes), personal income excluding transfers rose 0.1 percent in May, while real disposable income fell 0.1 percent. Over the last twelve months, real income excluding transfers is up just 1.8 percent while real disposable income is down 3.3 percent.
Weak growth for real personal income is a concern for the outlook for real consumer spending. Total personal consumption expenditures (PCE) rose 0.2 percent in May following a 0.6 percent rise in April (see second chart). Among the components, durable goods fell 3.2 percent while nondurable-goods spending rose 0.7 percent and spending on services increased 0.7 percent for the month.
In real terms, PCE fell 0.4 percent (see second chart) as real durable goods spending fell 3.5 percent, real nondurable goods spending decreased 0.6 percent and real services spending rose 0.3 percent.
The personal savings rate ticked up in May, coming in at 5.4 percent of disposable income following a 5.2 percent pace in April. Still, it remains well below the December 2019 pre-pandemic rate of 7.3 percent and at a relatively low rate by historical comparison (see third chart).
The price indexes from the report on personal income and spending are the primary measures followed by the Federal Reserve. The total PCE price index increased 0.6 percent in May as durable-goods prices rose 0.3 percent, nondurable-goods prices increased 1.2 percent, and services prices increased 0.4 percent. The PCE price index excluding food and energy rose 0.3 percent for the month.
Over the past year, the PCE price index is up 6.3 percent, the same pace as in the prior month but below the 6.6 percent pace in March. The core PCE index, which excludes food and energy prices, is up 4.7 percent from a year ago versus 4.9 percent in April and 5.2 percent in March.
Overall, ongoing disruptions to labor supply and production, shortages of materials, and logistics and transportation bottlenecks continue to exert upward pressure on prices. Furthermore, the fallout from the Russian invasion of Ukraine and periodic lockdowns in China continue to disrupt global supply chains while an intensifying policy tightening cycle by the Fed raises borrowing costs. For consumers, rapidly rising prices are hurting real incomes and fraying confidence in the outlook, suggesting a threat to real spending. The outlook for the economy remains highly uncertain and caution is warranted.

