

AIER’s Business Conditions Monthly indicators for June 2025 point to a sharper divergence in the US outlook. The Leading Indicator rose 8 points to 71, extending May’s rebound (from 63) and marking a year-to-date high. While still shy of early-2024 peaks, the upswing suggests firmer forward momentum heading into the second half of the year, even as policy uncertainties — especially around tariffs and rising input costs — create headwinds.
By contrast, the Roughly Coincident Indicator fell to 21 from 50 in a stark deceleration of near-term traction in real-time activity. The Lagging Indicator also declined to 25 from 42, giving back prior gains and indicating that backward-looking metrics are mirroring the slowdown visible elsewhere. As is typical late in the cycle, the delayed softening in lagging data counsels caution: leading signals are improving, but current conditions have deteriorated, and the gap between the two will need to close, whether through a genuine pickup in activity or a reversal in the forward indicators.
LEADING INDICATOR (71)
The Leading Indicator rose to 71 in June, with eight of twelve components improving, one unchanged, and three declining.
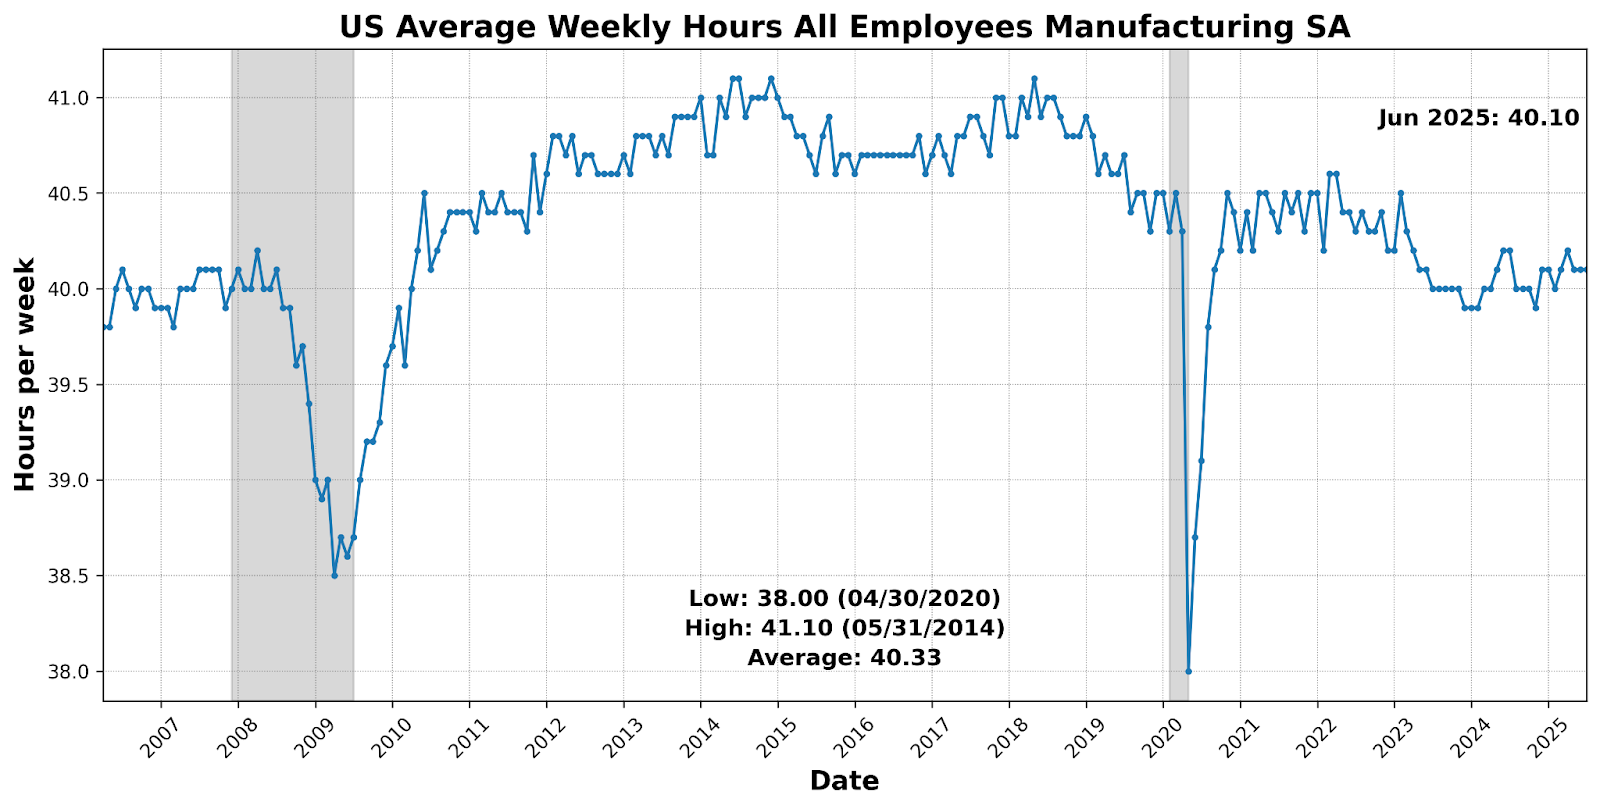
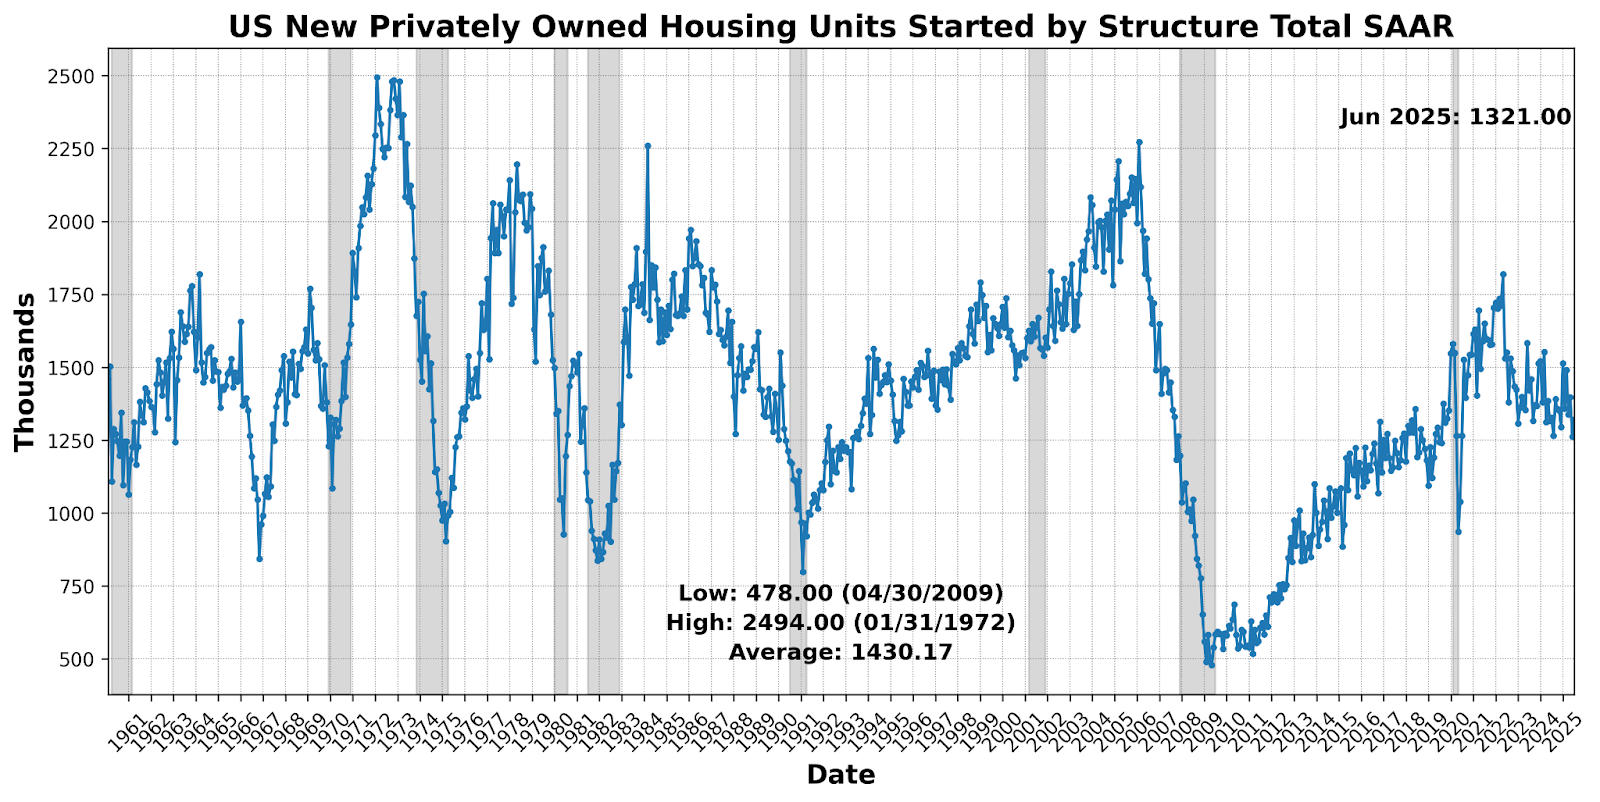
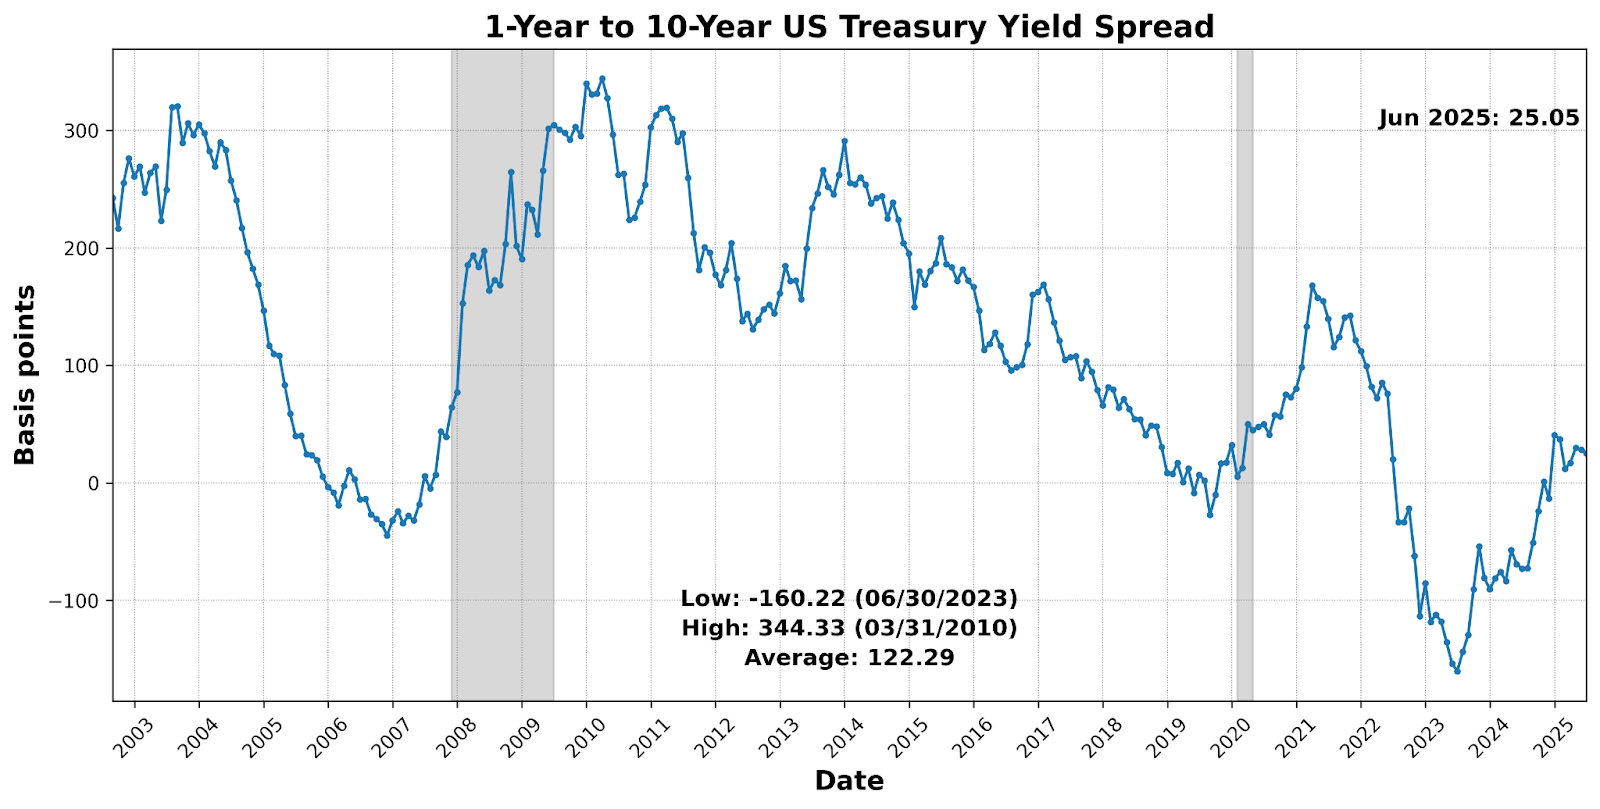
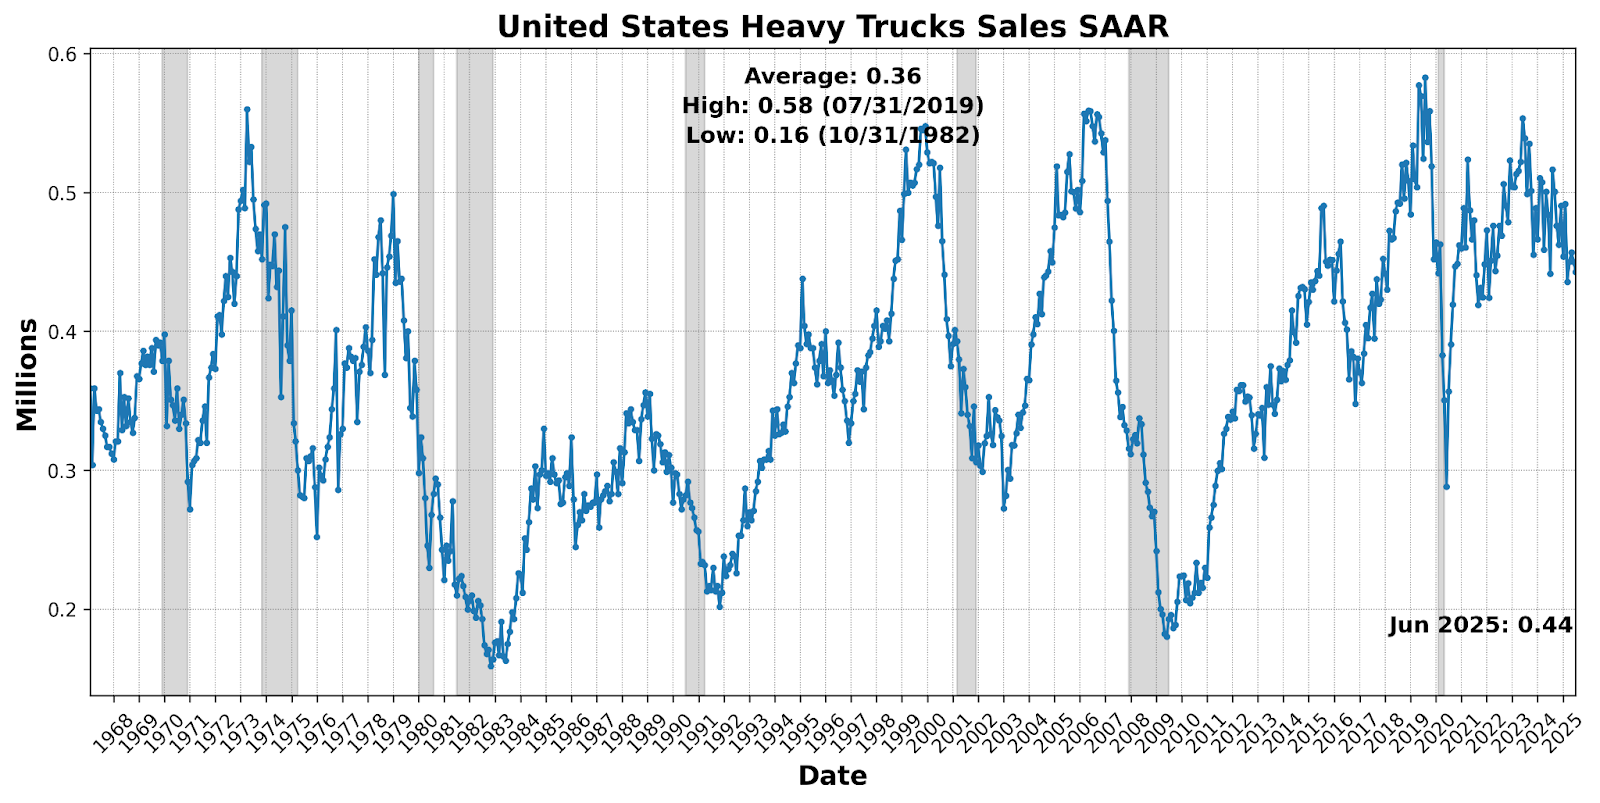
Gains were led by the University of Michigan Consumer Expectations Index (up 21.3 percent) and a steeper 1-Year to 10-Year US Treasury Yield Spread (bps) (wider by 11.5 basis points). Financial risk appetite firmed as Debit Balances in Customers Securities Margin Accounts increased 9.4 percent, while labor-market tone improved with US Initial Jobless Claims SA falling 6.5 percent. Real-economy forward gauges also advanced: US New Privately Owned Housing Units Started by Structure Total SAAR rose 4.6 percent; Conference Board US Leading Index Stock Prices 500 Common Stocks gained 3.8 percent; Adjusted Retail & Food Services Sales Total SA edged up 0.9 percent; and Conference Board US Leading Index Manuf New Orders Consumer Goods & Materials ticked up 0.2 percent. US Average Weekly Hours All Employees Manufacturing SA was unchanged. Offsets came from a lower Inventory to Sales Ratio Total Business (down 0.7 percent), softer Conference Board US Manufacturers New Orders Nondefense Capital Goods Ex Aircraft (down 1.2 percent), and weaker United States Heavy Trucks Sales SAAR (down 1.6 percent). Netting these moves, breadth improved across expectations, markets, housing, and claims, even as capex proxies and freight remained soft.
ROUGHLY COINCIDENT INDICATOR (21)
The Roughly Coincident Indicator fell to 21, reflecting a contraction in real-time activity: two of six components improved, one was unchanged, and three declined.
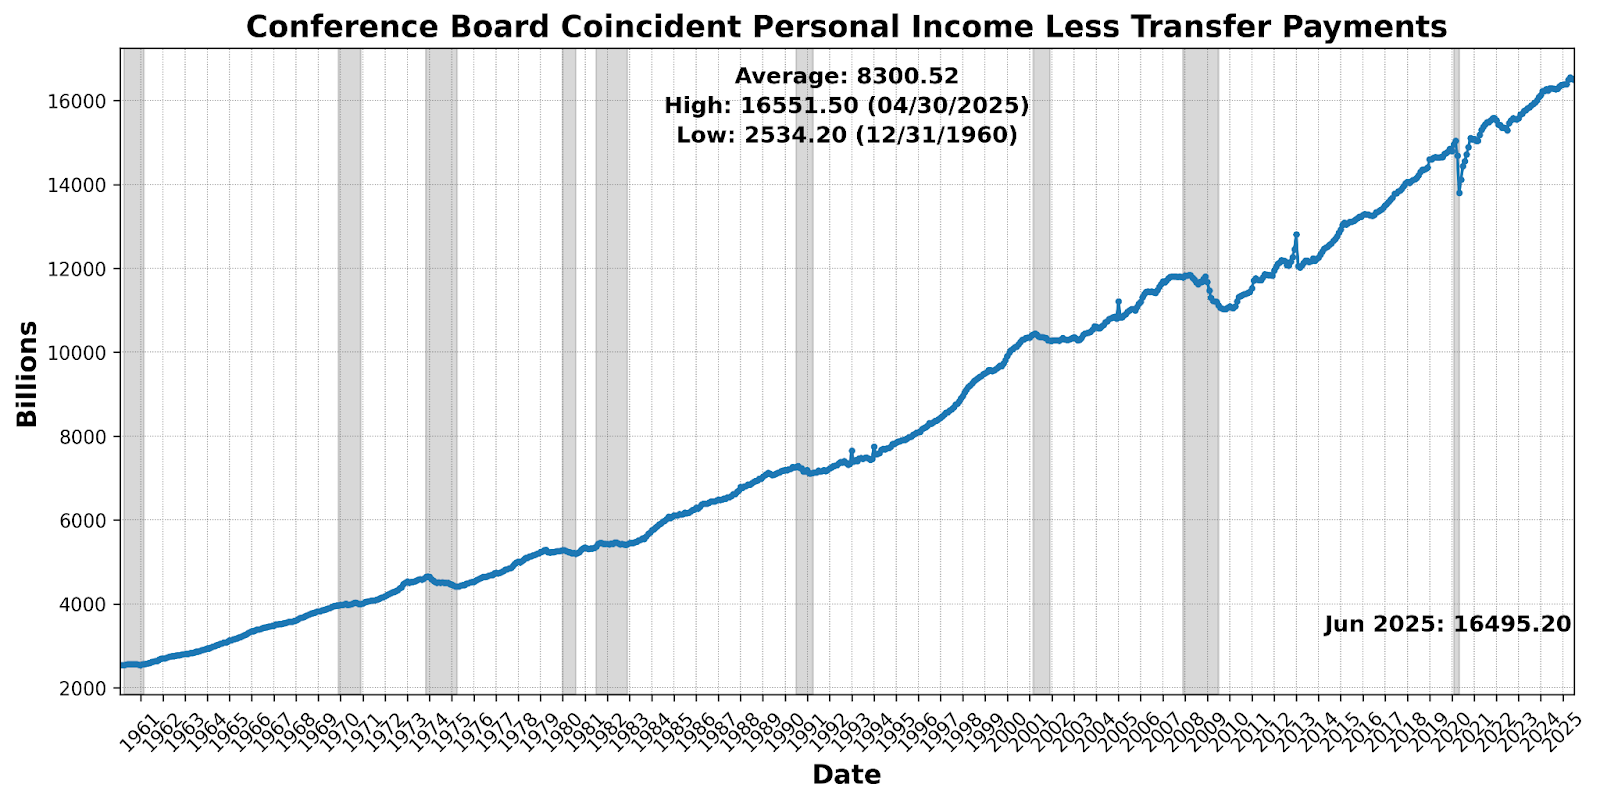
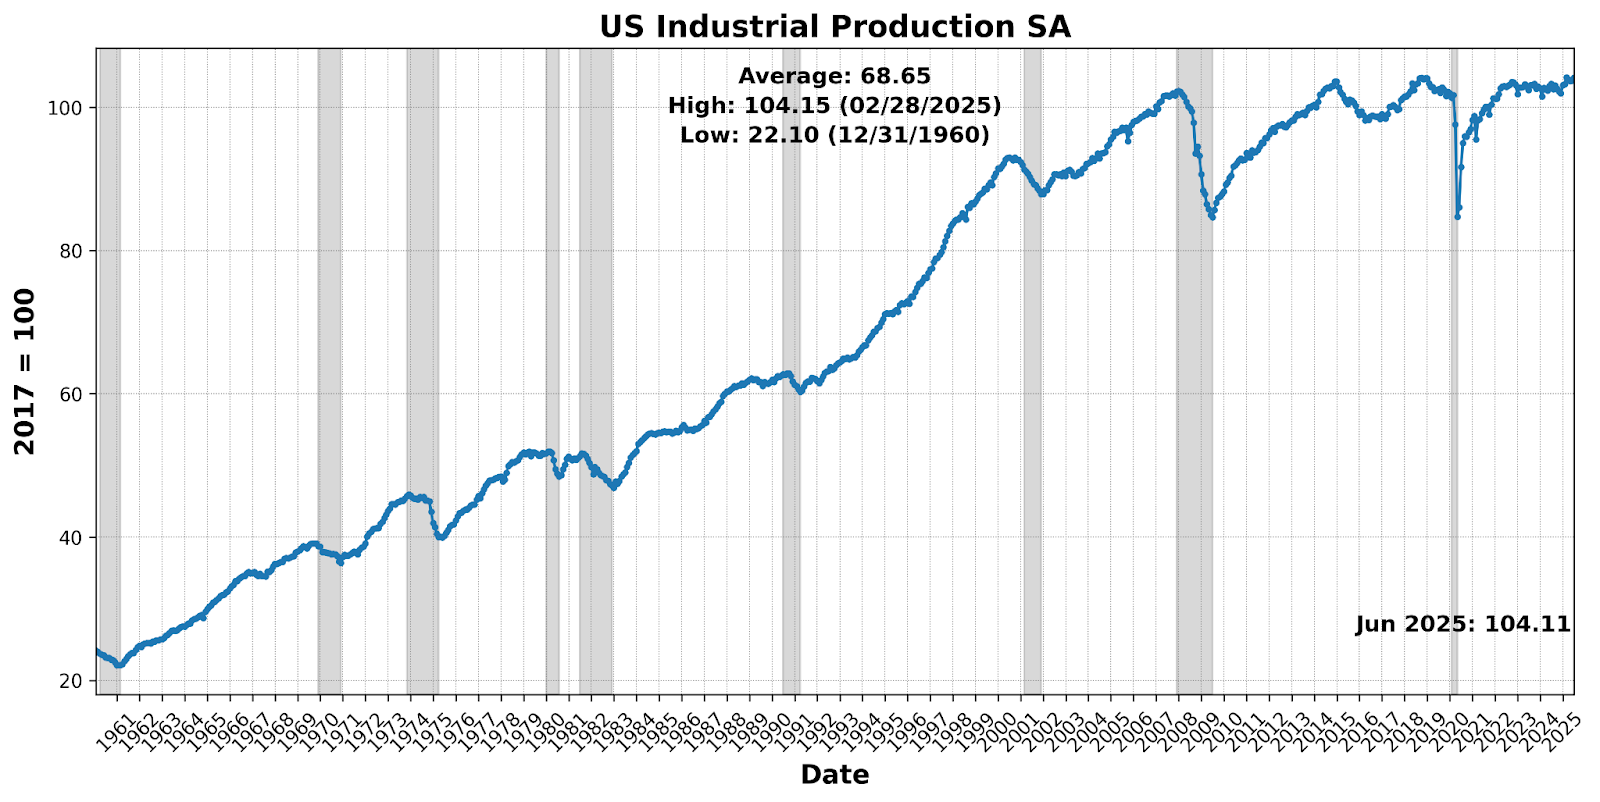
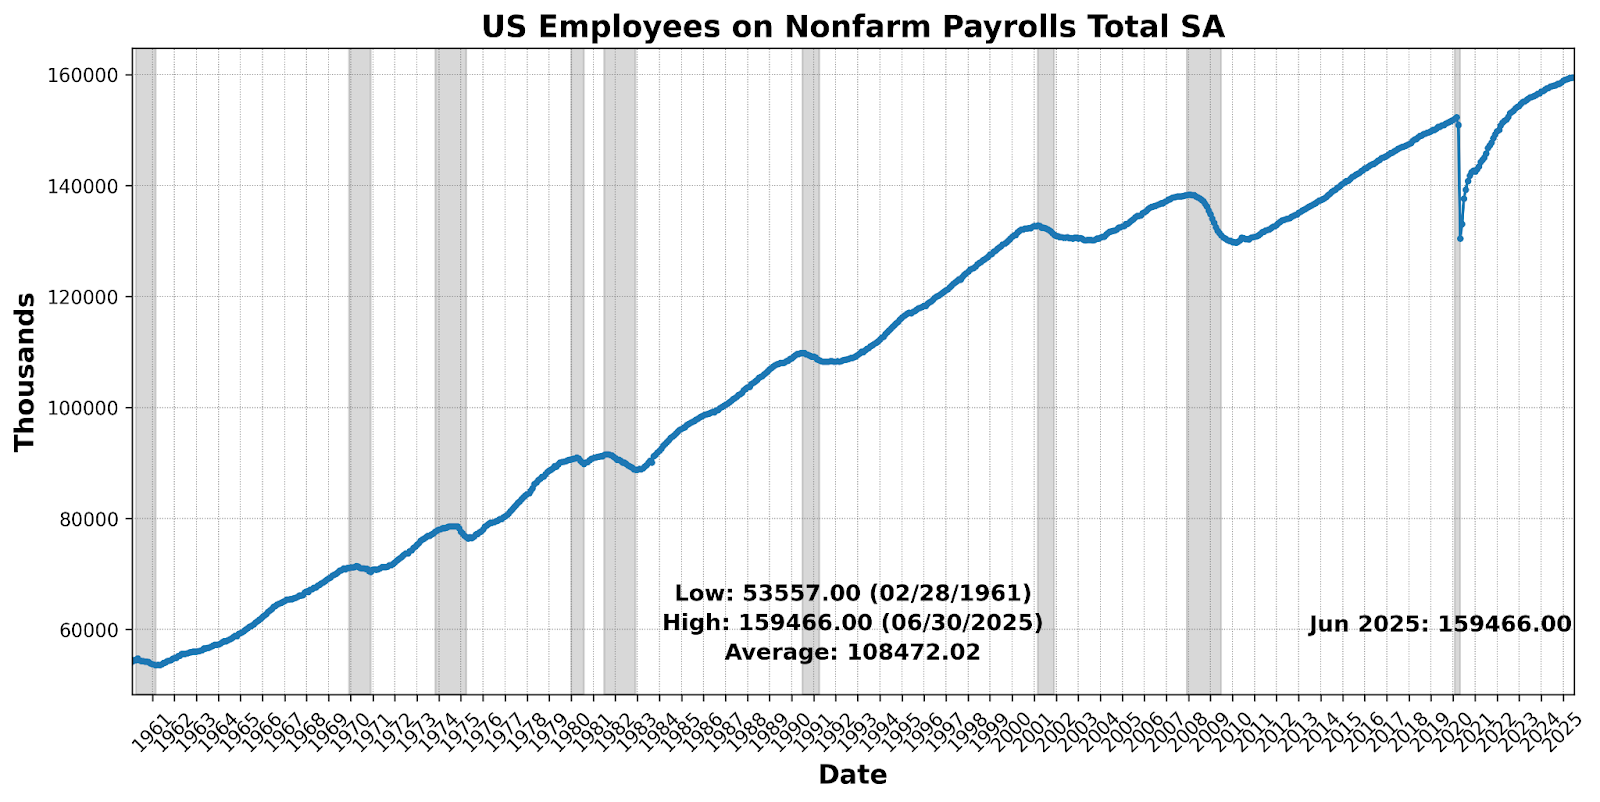
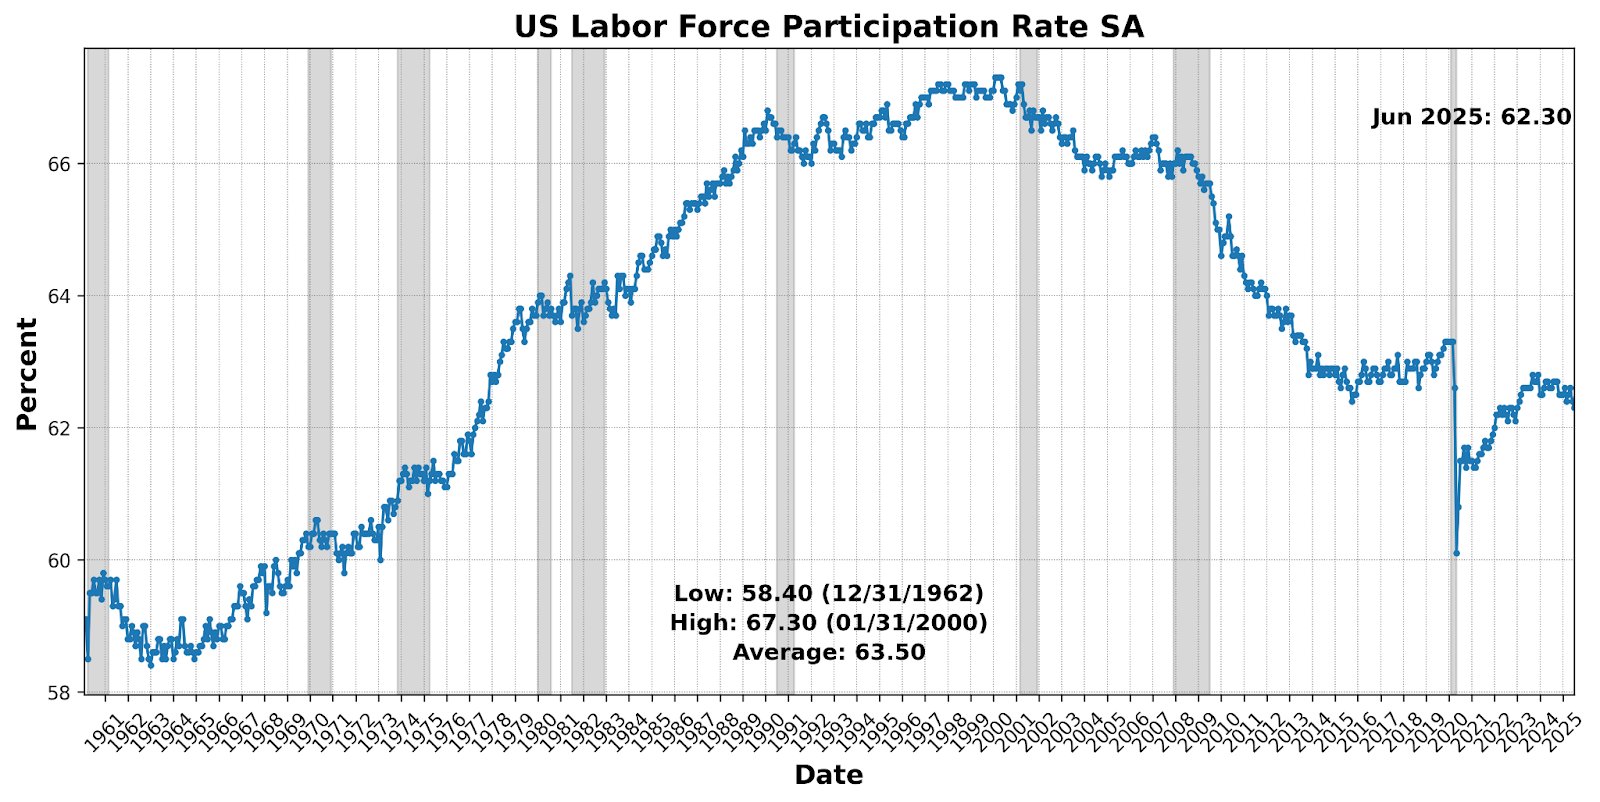
Gains were modest — US Industrial Production SA rose 0.4 percent and Conference Board Coincident Manufacturing and Trade Sales increased 0.3 percent — while US Employees on Nonfarm Payrolls Total SA was flat. Offsets dominated, with US Labor Force Participation Rate SA down 0.2 percent, Conference Board Coincident Personal Income Less Transfer Payments down 0.2 percent, and Conference Board Consumer Confidence Present Situation SA lower by 1.8 percent. The pattern points to current conditions losing traction: small production and sales advances are being outweighed by softer participation, income, and present-situation sentiment.
LAGGING INDICATOR (25)
The Lagging Indicator slid to 25, with breadth split three up, three down.
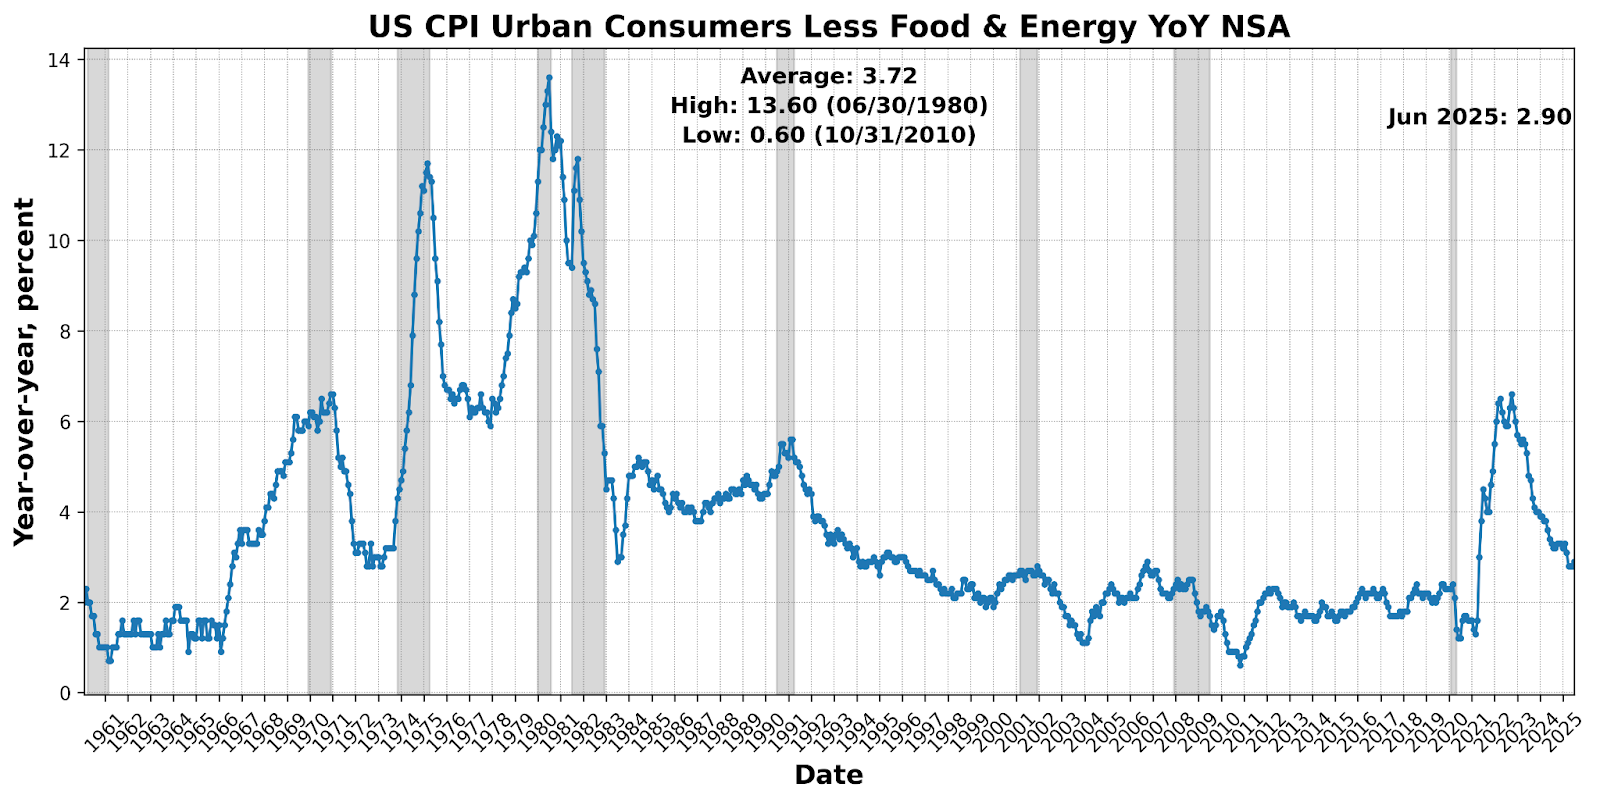
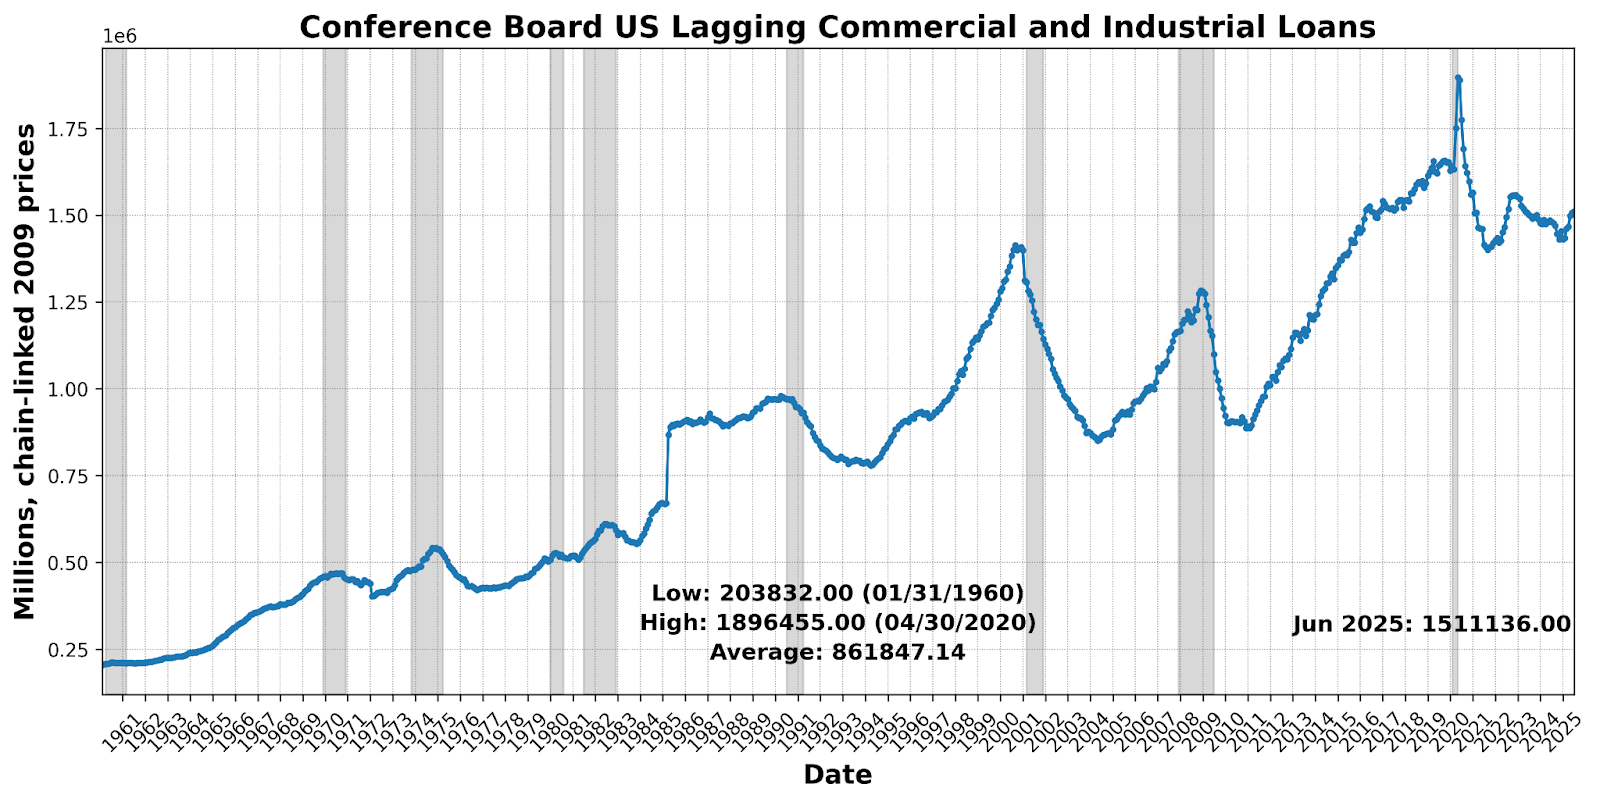
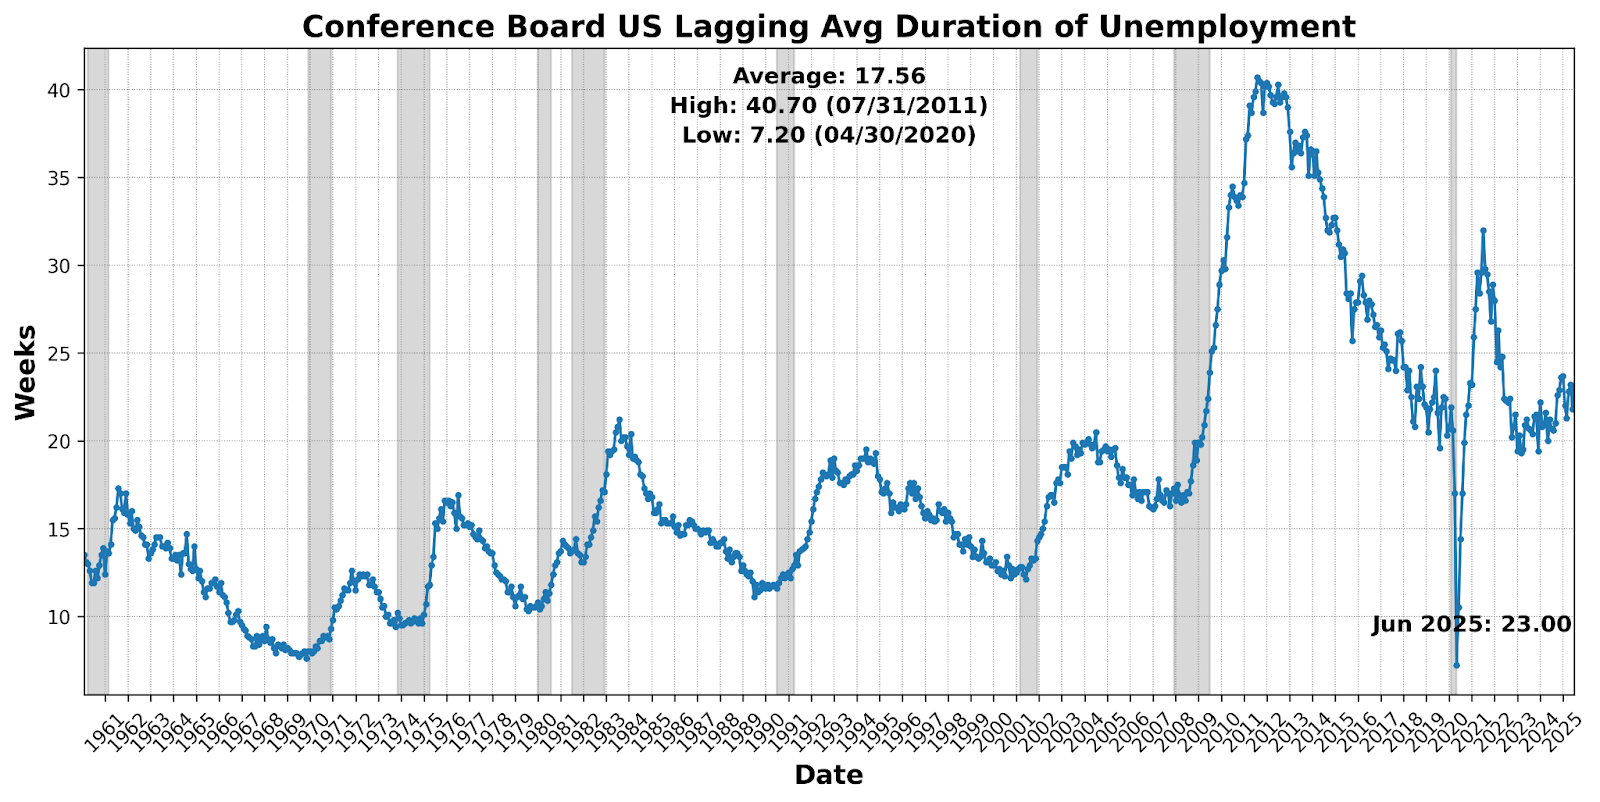
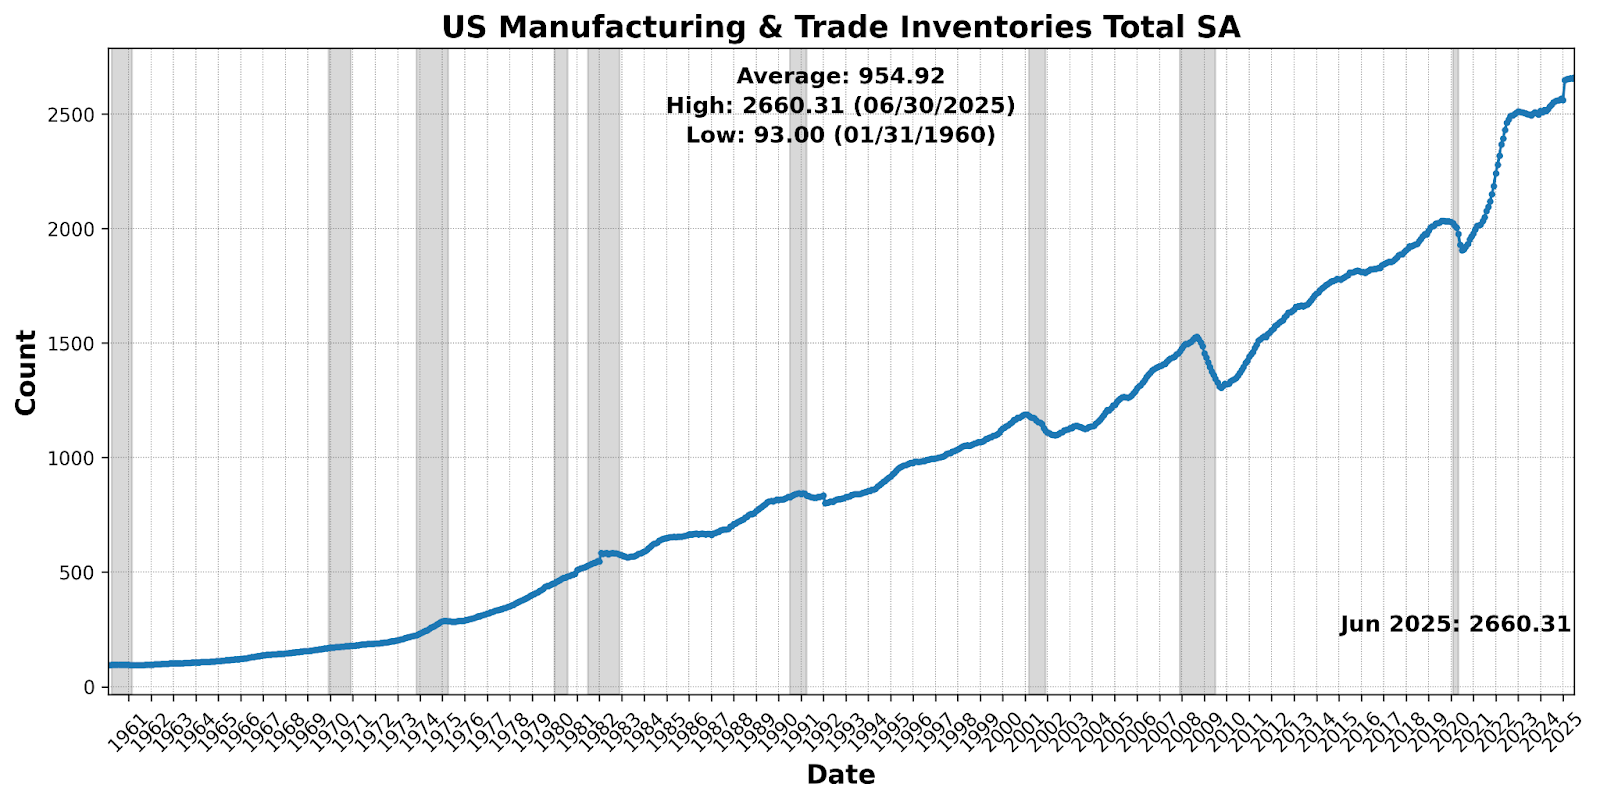
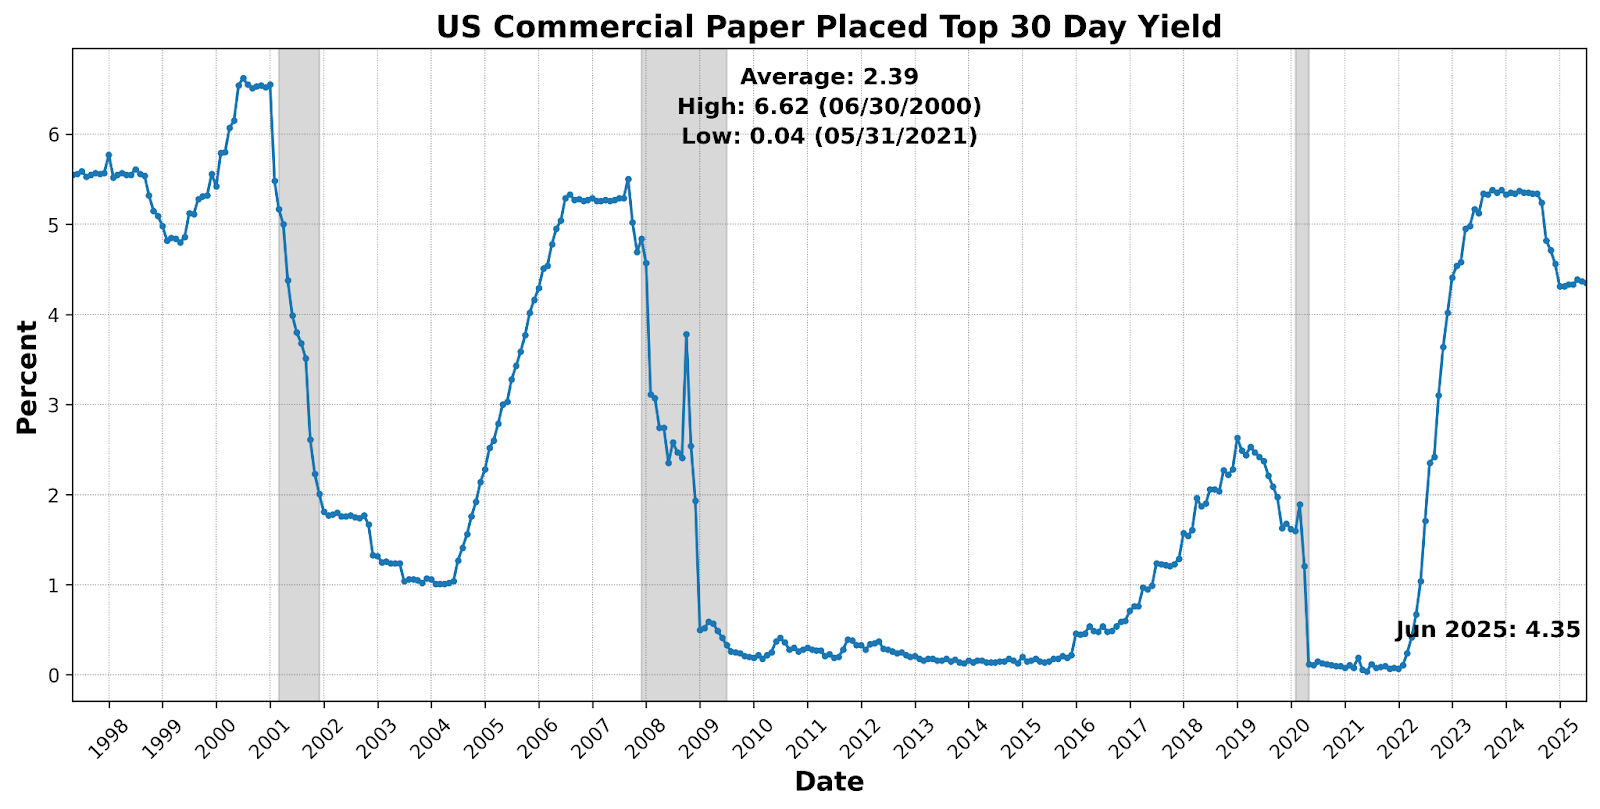
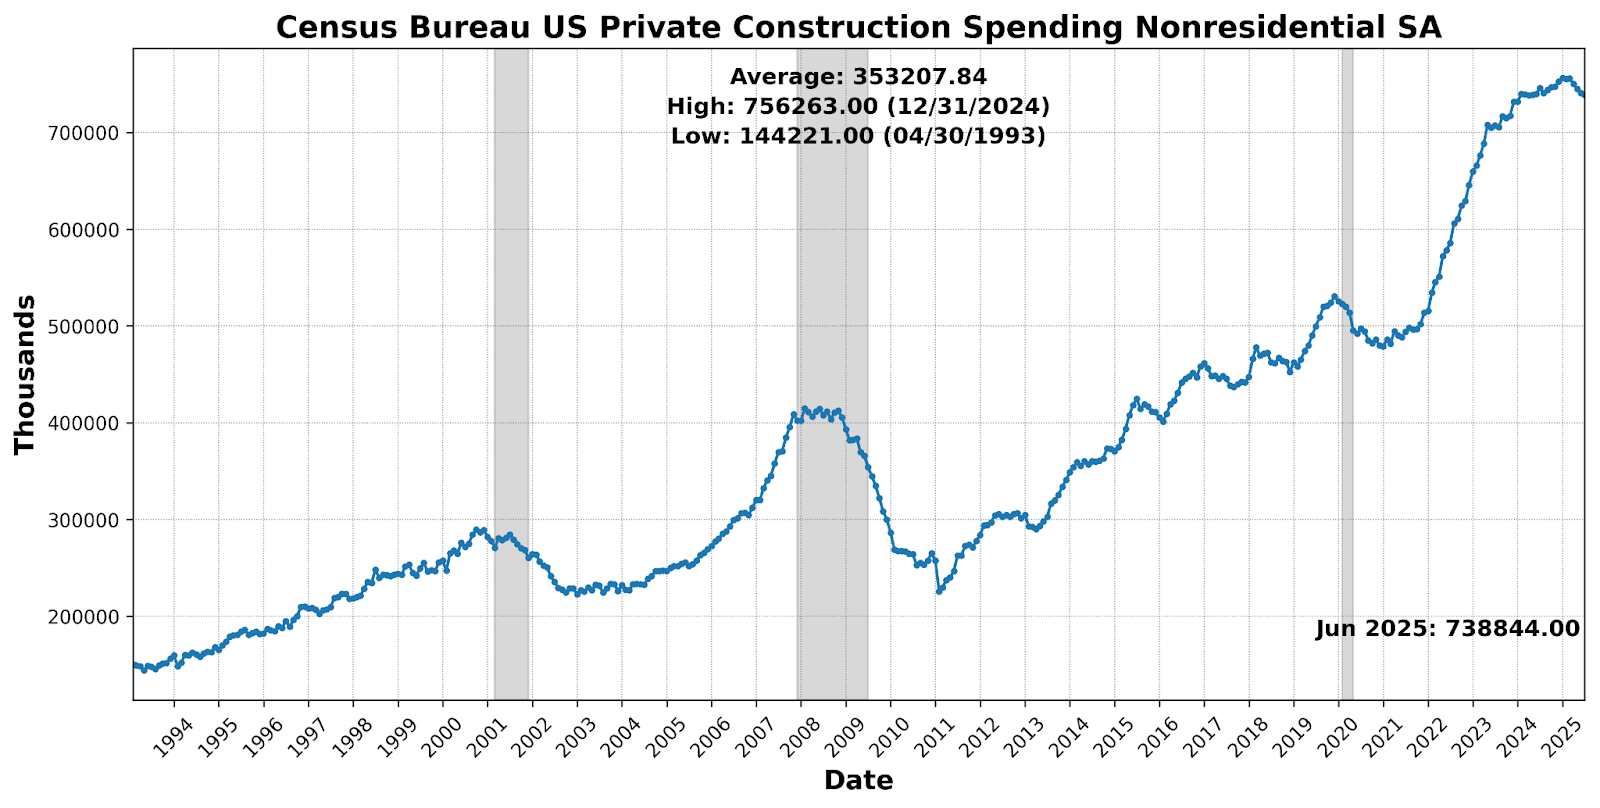
Price pressure persisted as US CPI Urban Consumers Less Food & Energy Year over Year NSA rose 3.6 percent, while financing and balance-sheet measures inched higher — Conference Board US Lagging Commercial and Industrial Loans (0.3 percent) and US Manufacturing & Trade Inventories Total SA (0.2 percent). Offsetting that, activity and short-rate proxies softened: Census Bureau US Private Construction Spending Nonresidential SA (-0.3 percent), US Commercial Paper Placed Top 30 Day Yield (-0.4 percent), and an outsized drop in Conference Board US Lagging Average Duration of Unemployment (-5.5 percent) weighed on the composite.
Through 2024 the three diffusion indexes painted an expansion with periodic soft patches. The Leading Indicator oscillated between 54 and 79, spending most of the year above the 50 line (notably 71 in April/September and 79 in November), consistent with forward momentum despite mid-year dips. The Roughly Coincident Indicator stayed elevated (58–92), pointing to solid current activity into year-end. By contrast, the Lagging Indicator drifted lower, sliding from 50 in January to 17 in December, a late-cycle pattern in which backward-looking gauges soften even as leads remain constructive.
The setting has flipped in 2025. The Leading Indicator initially sagged (54 to 38 from January to April) before staging a sharp rebound to 63 in May and 71 in June, among its strongest readings in 18 months. Meanwhile, the Roughly Coincident Indicator faded from 67 in early 2025 to 21 in June, signaling a marked loss of near-term momentum. The Lagging Indicator has whipsawed, spiking to 83 in January, easing to 75 in February, then sliding to 42 in May and 25 in June, a considerable reversal of the expansion visible earlier in the year.
Historically, such gaps do not persist; the economy will either re-accelerate toward the leads or the leads will prove a headfake as coincident/lagging softness asserts itself. For now, the balance tilts toward caution; near-term risks are accumulating, and the second half will hinge on whether June’s Leading Indicator bounce translates into actual activity amid the headwinds outlined in the discussion below.
Discussion, July – August 2025
Through mid-summer 2025, price signals split between a still-soft consumer read and a hotter upstream profile. June CPI undershot consensus even as tariff pass-through quickened: headline rose 0.29 percent m/m (2.7 percent y/y) and core 0.23 percent m/m (2.9 percent y/y), with core running at roughly 2.8 percent (1-mo), 2.4 percent (3-mo), 2.7 percent (6-mo) annualized — levels comparable to or below those prevailing when the Fed eased last fall. Energy added a few basis points, food-at-home firmed, and core goods turned up (notably apparel, appliances, audio, furniture) while vehicles and lodging softened; core services edged higher on medical services with rents/owner-equivalent rents still muted. Inflation diffusion measures point to broader — but not runaway — pressures, consistent with tariff effects spreading even as several tariff-exposed lines that led earlier appear near peak pass-through. In contrast, July PPI strengthened across all major buckets — goods the firmest since early 2023 and services the strongest since 2022 — implying pipeline cost pressure hasn’t fully fed through to consumers and broad margin absorption is unlikely.
Historically, core PPI leads core PCE with a tight directional link; last month’s benign PPI pointed to core PCE in the mid-two percent range, whereas this month’s jump implies re-acceleration toward about 3 percent by September. As of the end-July release, the Fed’s preferred inflation benchmark, PCE, had already firmed — headline PCE rose 0.3 percent month over month and 2.6 percent year over year, core PCE rose 0.26 percent month over month, prior months were revised higher, lifting the three- and six-month annualized core trends to 2.6 percent and 3.2 percent, and year-over-year core printed 2.79 percent — while income advanced faster than expected on transfers and spending grew modestly as consumers tilted toward necessities. Netting CPI’s “compositional” softness against a firming PPI backdrop and a firmer prior PCE print, the inflation mix points to late third quarter consumer inflation edging higher — more visibly in core PCE than CPI — and argues for policy makers to favor caution over an imminent cutting cycle.
From a dual-mandate vantage point, the price level side argues against accommodation for now, but on the employment side a cut has rarely looked more urgent: July’s nonfarm payrolls rose a seasonally adjusted 73,000, and massive back revisions knocked a further 258,000 off prior months (June to 14,000; May to 19,000), leaving three-month average job growth near 35,000 — well below the estimated 80,000–100,000 breakeven for a steady unemployment rate and likely negative after adjusting for an estimated 80,000 per month birth-death overstatement since the April 2 tariff announcement; private payrolls were 83,000 (health care led), key drags included manufacturing, professional and business services, and government (notably local government −3,000), with the unemployment rate up to 4.25 percent from 4.12 percent even as the labor force contracted for a third month and participation slipped again to 62.22 percent, the household survey showing a 260,000 drop in employment; average weekly hours ticked up to 34.3 from 34.2 and hourly earnings rose 0.3 percent, lifting weekly pay 0.6 percent, but the composition of gains, the shrinking labor force, and the scale of revisions indicate labor demand is falling faster than supply — contradicting the notion of a “solid” market Powell referenced — while forward risks skew toward government and education propping up headline prints into fall amid expected cuts to DOGE-related grants, all of which raises the probability of an earlier and potentially larger easing than a single December move.
Consulting other data points on the state of the US labor market yields a mixed but, on net, confirming picture of July’s dour BLS signal: ADP reported private payrolls up 104,000 in July versus a 76,000 consensus estimate, with wage growth steady for job stayers at 4.4 percent and job changers at 7 percent and a second-quarter GDP print of 3 percent suggesting underlying demand, while service industries added 74,000 and goods producers 31,000; however, JOLTS showed openings falling by 275,000 to 7.44 million with the vacancies-to-unemployed ratio slipping to 1.06, quits holding at 2.0 percent after downward revision, and evidence that firms are managing headcount via slower hiring and hours rather than pink slips. Weekly claims likewise point to slack building through weaker re-employment rather than rising layoffs: initial claims edged down to 224,000 but continuing claims remained elevated at 1.953 million, the exhaustion rate has been climbing, and the rise is concentrated in places like Washington, DC amid government-related cuts, including roughly 292,000 announced layoffs tied to DOGE actions this year. Taken together, the ADP upside and steady pay gains modestly temper the narrative, but the deterioration in openings, quits, and continuing claims — and the sectoral and geographic pattern of weakness — largely corroborate the BLS message that labor demand is fading faster than supply.
The week of July 28, 2025 delivered an unusually dense slate of macro releases, and through Friday, August 1 the aggregate picture still suggested ongoing expansion tempered by mounting risks; yet it was not only the July nonfarm payrolls shock that altered that assessment — soon after, the ISM Manufacturing index was released. The overall index fell one point to 48 (its fifth consecutive month in contraction and the fastest overall contraction in nine months) as the employment subindex slid to its lowest level in more than five years amid shrinking orders, softer backlogs and exports, and supplier deliveries improving with the delivery index dropping nearly five points below 50 for the first time since November; government data the same morning showed factory employment declining for a third straight month while the three-month average gain in total payrolls was the smallest since the pandemic, reinforcing survey commentary about active headcount management and cautious hiring even where production edged higher (the only main ISM component in expansion); input-cost pressure eased at the margin with prices paid falling nearly five points to 64.8, but respondent anecdotes highlighted tariff-driven uncertainty suppressing forward orders, complicating sourcing strategies, pressuring margins despite strong end-market niches, and delaying blanket purchases — dynamic likely to persist given the administration’s latest country-based tariff announcement that held many baseline rates at 10 percent while leaving potential adjustments on pharmaceuticals, semiconductors, critical minerals, and other key inputs unresolved.
The services side, released a few days later, was not substantially better than the manufacturing report: ISM Services slipped to 50.1 — below all economist estimates and effectively at stall speed — with the employment index down to 46.4 (its fourth contraction in five months and among the weakest since the pandemic) while prices paid climbed to the highest since October 2022. Business activity expanded but slowed from June and new orders eased to 50.3, with survey commentary pointing to tariff-related cost pressure, client delays, and caution in forward purchasing; breadth was mixed (eleven industries expanding, seven contracting, led by accommodation and food services), and the hiring softness reflected freezes and non-backfills rather than broad layoffs. Backlogs shrank for a fifth straight month, inventories grew at a slower pace, and inventory sentiment fell nearly four points to 53.2 (the lowest since October). The report aligned with concurrent macro signals — revised-down job growth, barely rising real consumer spending, and a June trade deficit that narrowed to its tightest since September 2023 as firms retrenched on imports — reinforcing a risk-tilted, late-cycle tone rather than a clean handoff from manufacturing weakness to services resilience.
Consumer and business sentiment diverged in tone but converged on caution over the past month. The University of Michigan’s preliminary August read showed consumers turning measurably more downbeat — headline sentiment slipped to 58.6 (from 61.7), one-year inflation expectations rebounded to 4.9 percent and long-run to 3.9 percent, 62 percent expect unemployment to rise, and 58 percent say they plan to cut back spending, with buying conditions for durables at a one-year low — even as retail sales notched a second monthly gain. Small firms, by contrast, reported a modest improvement: the NFIB Optimism Index rose 1.7 points to 100.3 (a bit above its long-run average), hiring plans ticked up and more owners intend capital outlays, yet uncertainty jumped to one of the highest readings on record, profit trends remained negative, and capex intent stayed below its historical norm. The sources of unease differ: households cite tariff-driven price risks, job security, and borrowing-cost views split along partisan lines; businesses point to trade and policy uncertainty, mixed demand, and lingering labor frictions (sector-specific hiring difficulty) even as fewer plan price hikes, implying limited near-term pass-through. Netting the two, “hard” spending data are holding up for now, but both sides signal rising precaution — consumers via intent to retrench, firms via elevated uncertainty that could restrain hiring and investment unless the policy outlook clarifies.
Do the resumption of rapidly rising prices, a deteriorating job market, cautious consumers and firms, and weakening services/manufacturing square with the latest Beige Book and retail sales data? Largely, but with timing nuance: the July Beige Book (through July 7) upgraded activity to “increased slightly,” noted employment “increased very slightly” and price growth “mostly similar” to prior reports, yet emphasized tariff-driven input costs reported as “modest to pronounced” in all 12 districts and warned those pressures could lift consumer prices by late summer — signals consistent with today’s firmer inflation pipeline and broad caution in hiring and investment. July retail sales, meanwhile, posted a solid goods read — headline up 0.5 percent month over month, ex-autos up 0.3 percent, and the GDP-relevant control group up 0.5 percent — boosted by major online promotions and broad category gains, but the figures are not inflation-adjusted and restaurant/bar spending fell, underscoring softness in discretionary services. Taken together, retail’s “hard” goods strength and the Beige Book’s slight improvement do not refute the darker employment and survey data that arrived more recently. Rather, they depict an economy that was still expanding in early July even as tariff-related cost pressures and rising uncertainty were setting the stage for the subsequent deterioration in labor demand, services momentum, and sentiment.
Continuing: do July 2025 industrial production and capacity utilization trends corroborate the ISM’s contractionary signal for manufacturing? Broadly, yes: industrial production slipped 0.1 percent in July after a 0.4 percent gain in June, manufacturing output was flat (following an upwardly revised 0.3 percent in June), and both mining and utilities declined, echoing ISM’s sub-fifty readings from March through July. The mix also rhymes with ISM details — durables (autos, aerospace) offsetting weaker nondurables (textiles, apparel, petroleum), slower consumer-goods output, and declines in construction and business supplies — leaving factories effectively at stall speed. Capacity utilization eased further below its long-run average, with overall utilization down to 77.5 percent and factory utilization to 76.8 percent, consistent with building slack in survey data. After a first-half lift from pre-tariff order pulls and a Boeing restart, output has simmered as firms face cooler demand, tariff-related input costs, and policy uncertainty; and with a new Boeing strike starting August 4 threatening transportation equipment, the production side likely remains aligned with ISM’s caution even as retail sales strength and a firm New York regional survey offer limited offset.
In the aggregate, late July and early August economic data describe an economy still consuming in nominal terms but increasingly wrestling with tariff-driven cost pressure and fading labor momentum — exactly the cross-currents that narrow the Fed’s policy runway — while last month’s backdrop remains salient. Fed officials earlier warned large tariff hikes could push up prices; that concern hasn’t been put to rest, but some (e.g., Kansas City’s Schmid and Richmond’s Barkin) argue the latest CPI doesn’t justify an immediate cut, reflecting the mandate trade-off as labor softens while price pressures diffuse. Markets disagree: Fed-dated OIS fully prices a quarter-point cut in September (implied ~4.08 percent) and about 62 basis points of easing over the three remaining meetings this year. With retail sales nominally firm but sentiment weakening, equity indices near highs, and tariff pass-through increasingly evident in upstream data, the “narrow tightrope” described in our prior report has become thinner and shakier — pipeline inflation is re-accelerating just as real-economy momentum cools. These competing dynamics leave the Fed with less room to maneuver and raise the odds that any misstep reverberates across both prices and jobs. Downside risks remain elevated.