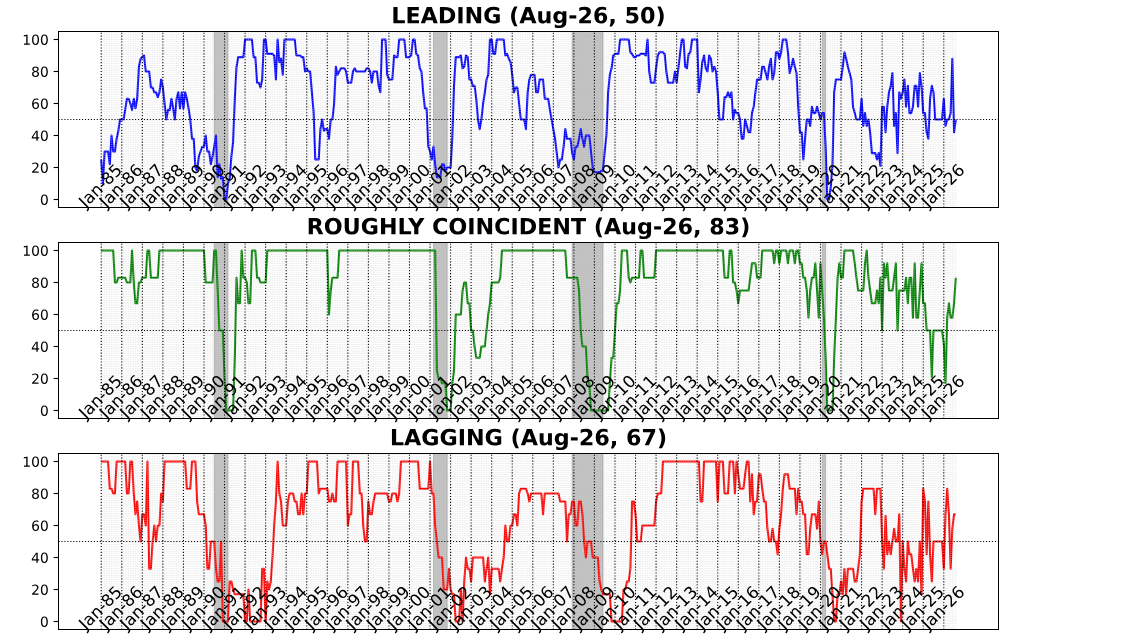
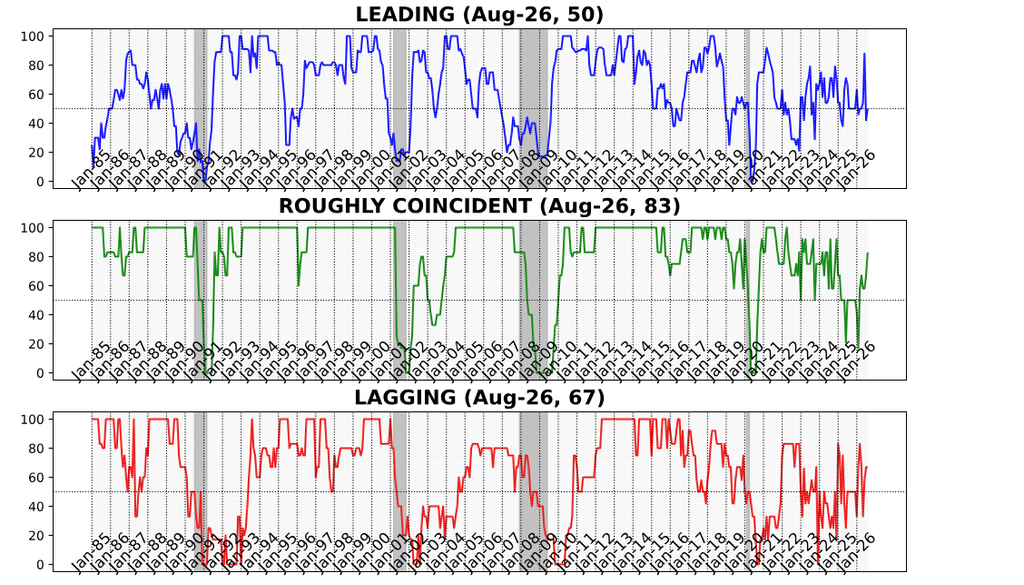
The August 2026 AIER Business Conditions Monthly (BCM) points to stronger current economic activity but a still-divided outlook. The Leading Indicator recovered to 50 from July’s 42, returning to neutral as improvements in financial markets, retail sales, manufacturing hours, and capital-goods orders were offset by weakness in consumer expectations, housing, transportation, and other components. The Roughly Coincident Indicator climbed to 83 from July’s corrected reading of 67, with five of six measures advancing. The Lagging Indicator remained at 67, leaving the overall configuration more constructive than in July without establishing a broadly favorable forward-looking signal.
AIER Business Conditions Monthly Indicators – All Time
AIER Business Conditions Monthly Indicators – Five years
LEADING INDICATOR (50)
The Leading Indicator rose to 50, with six of 12 components improving and six declining. None fell within the unchanged band.
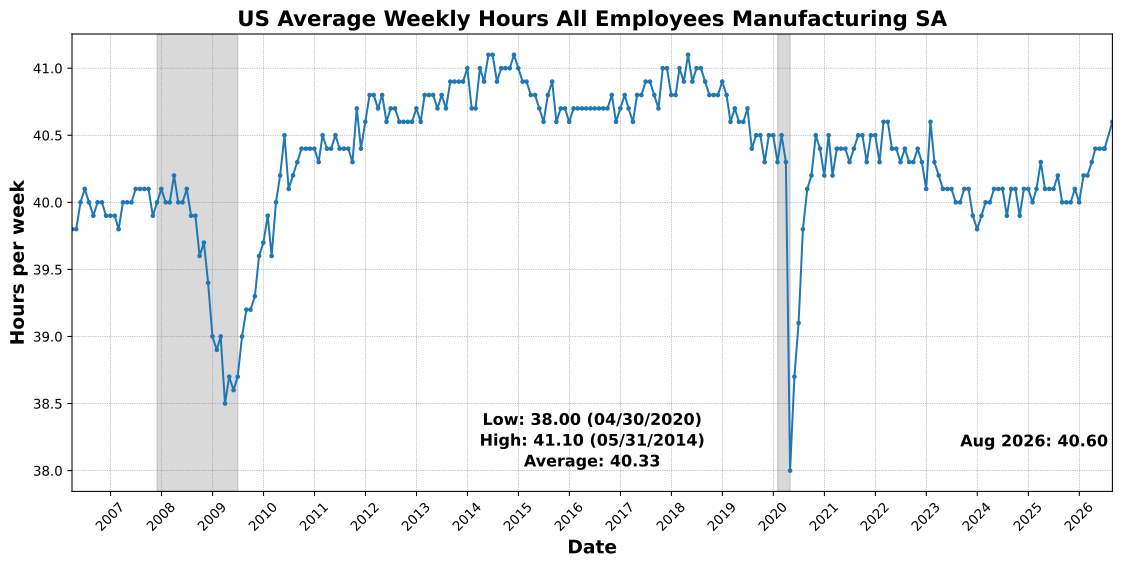
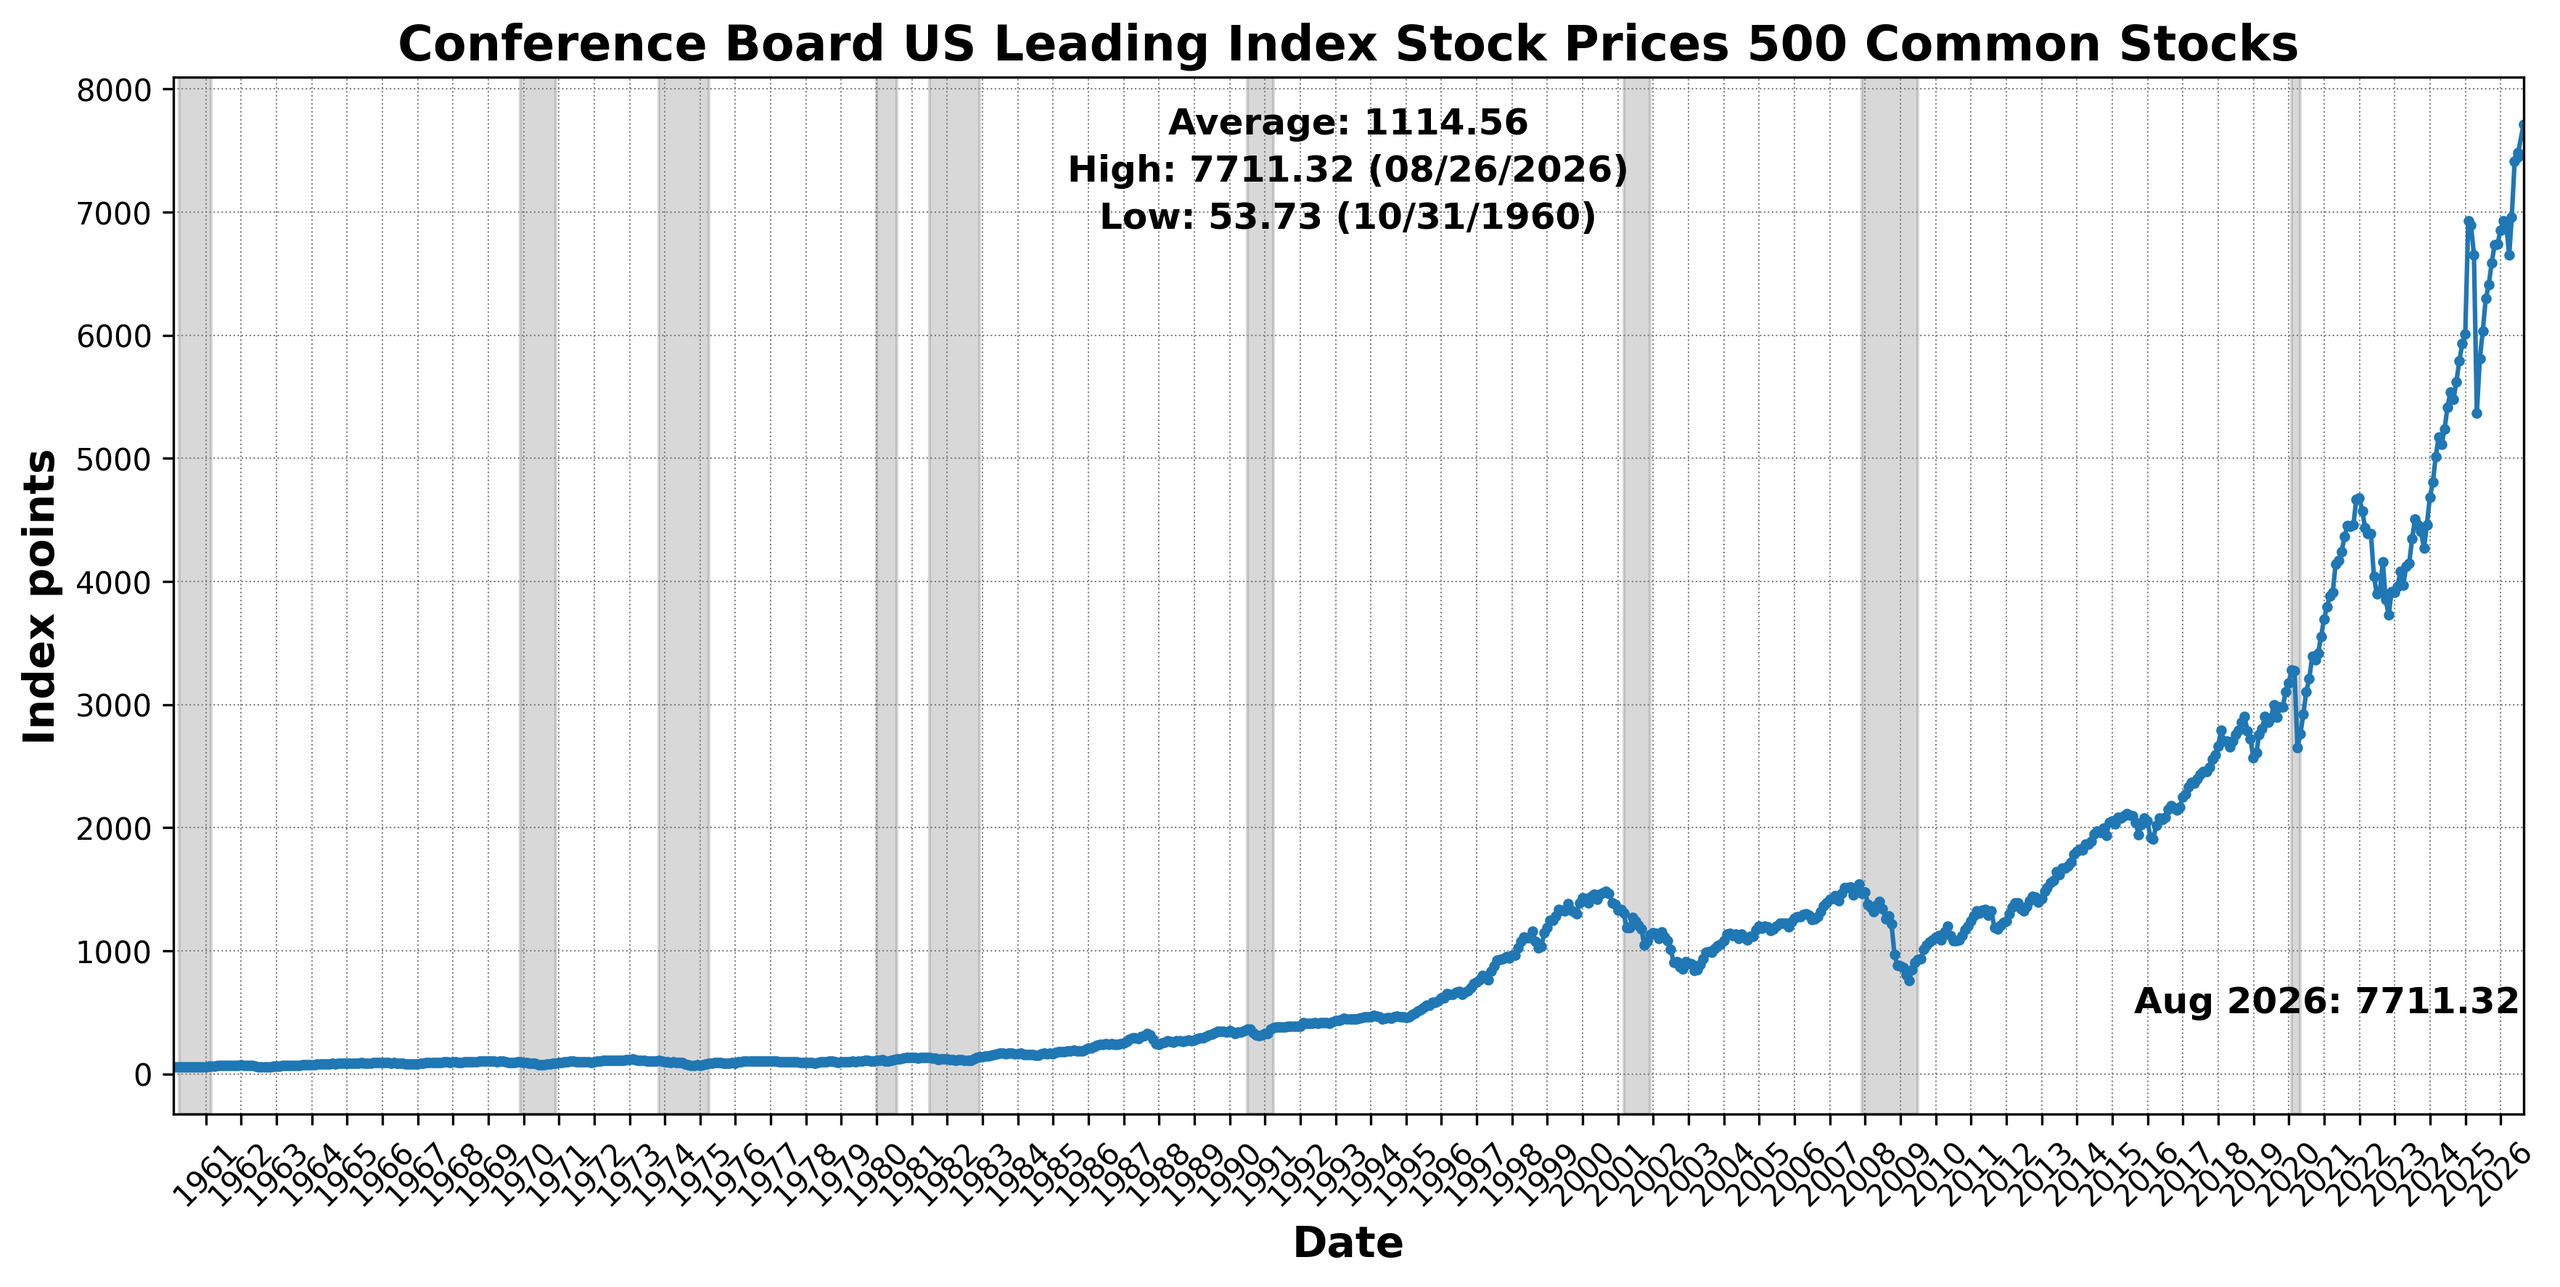
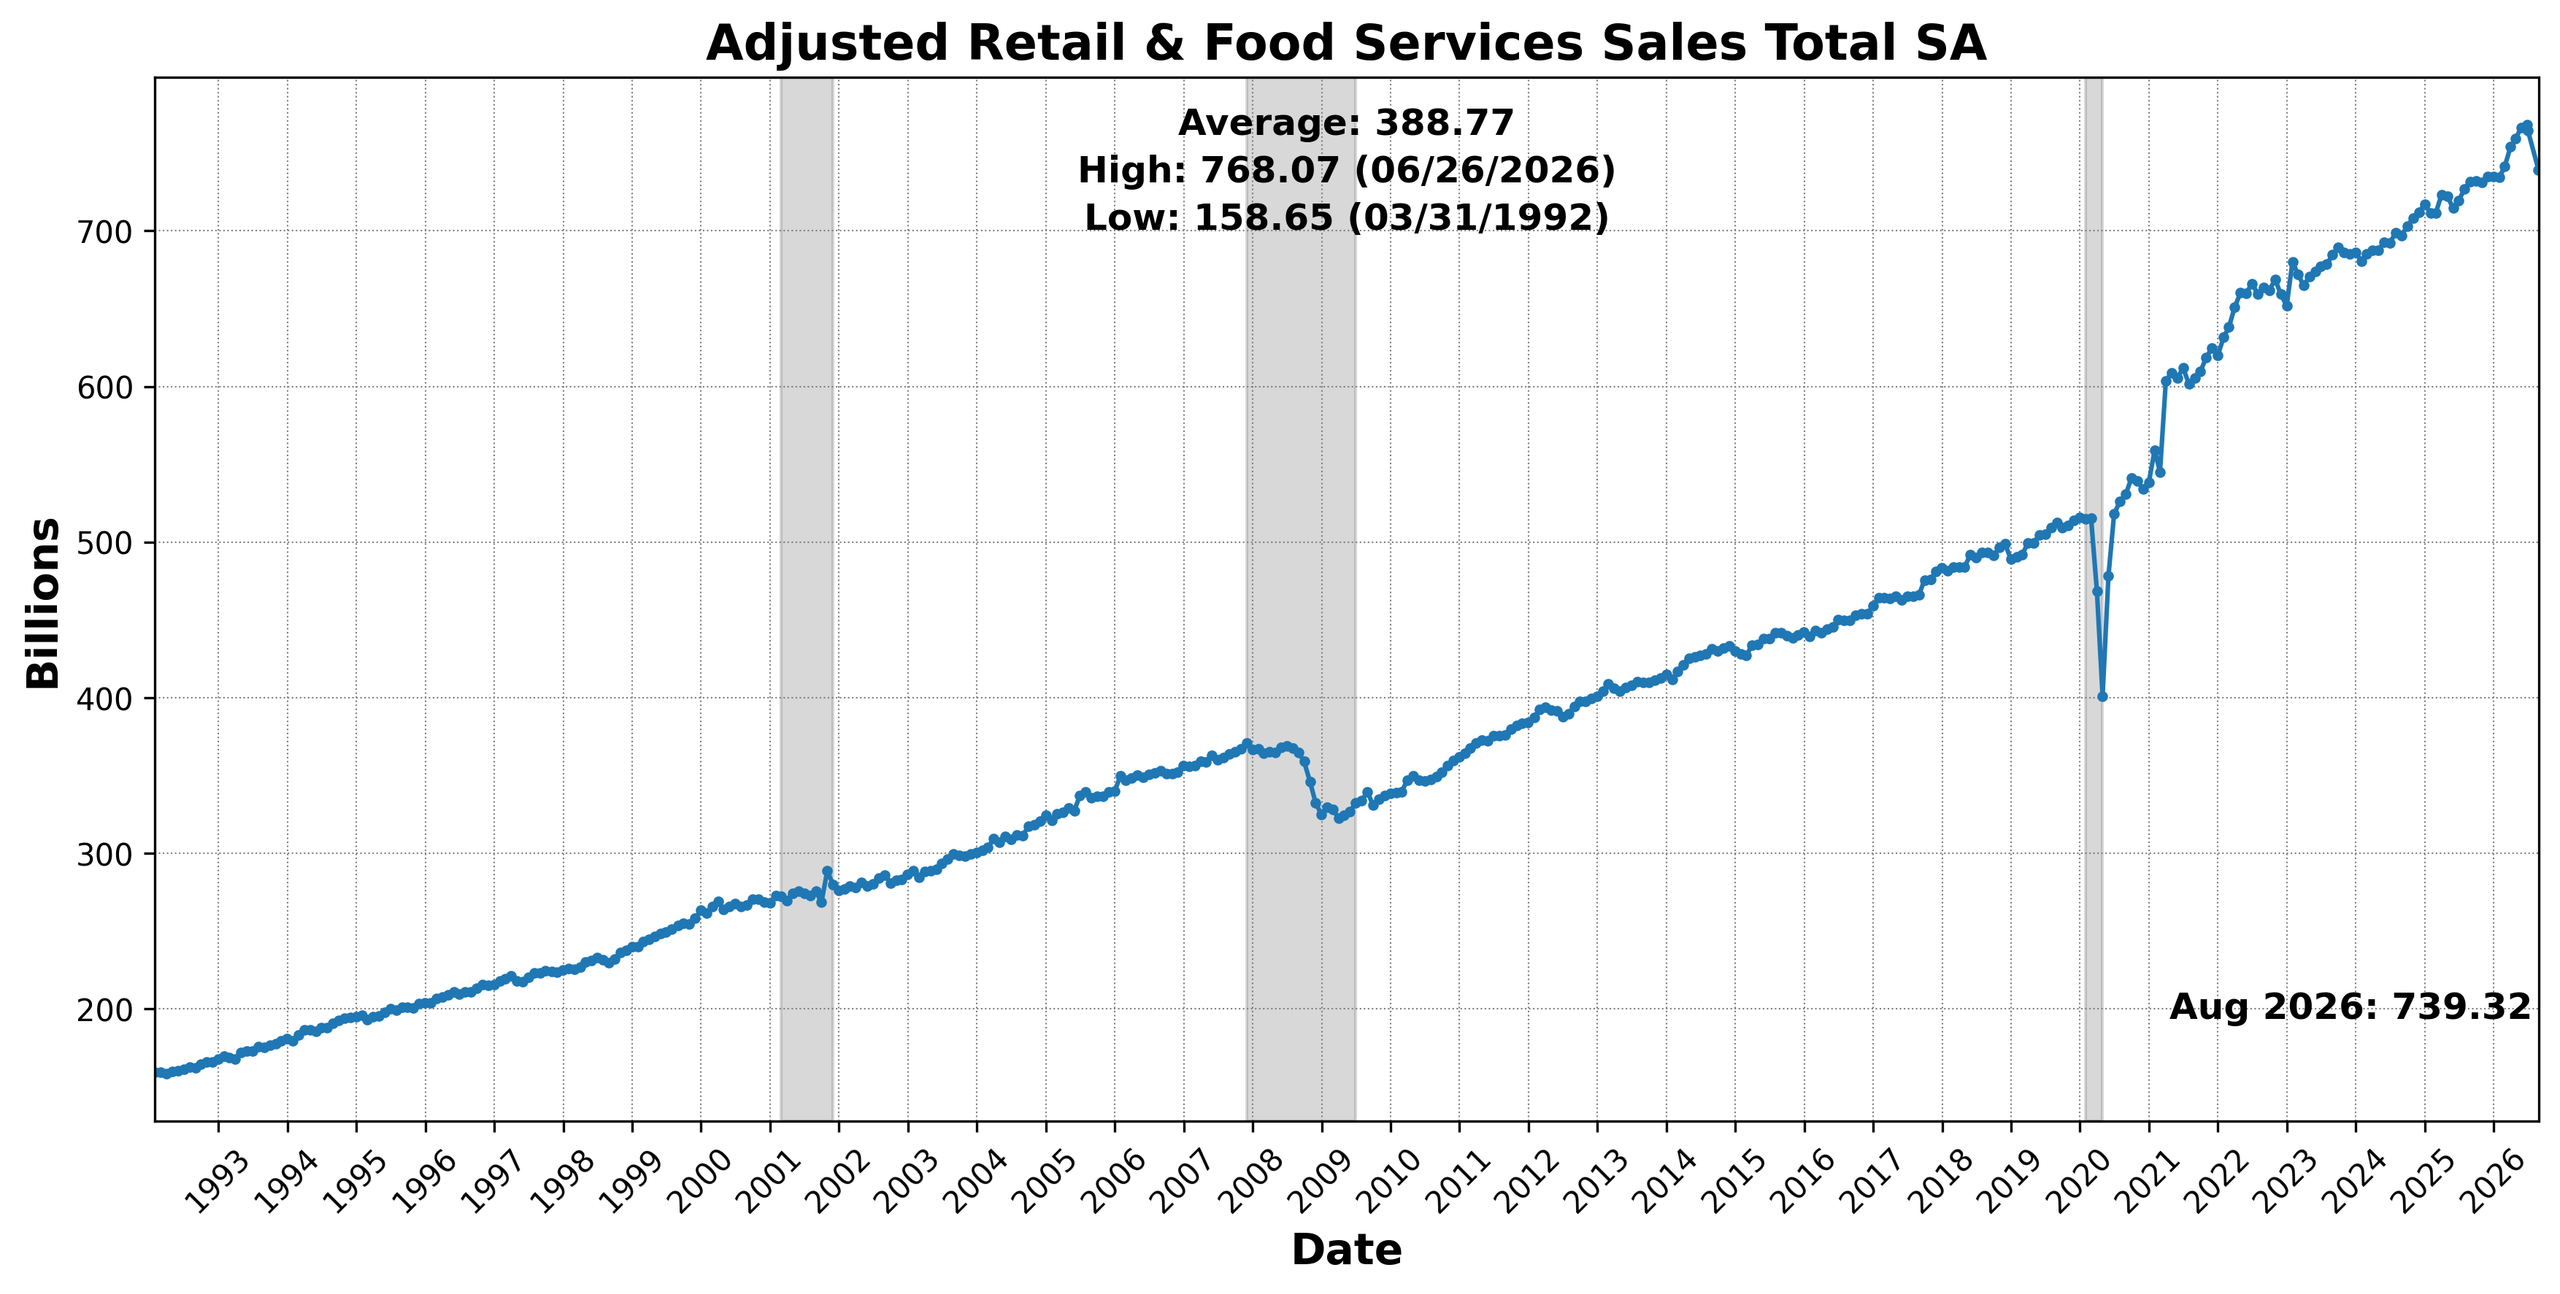
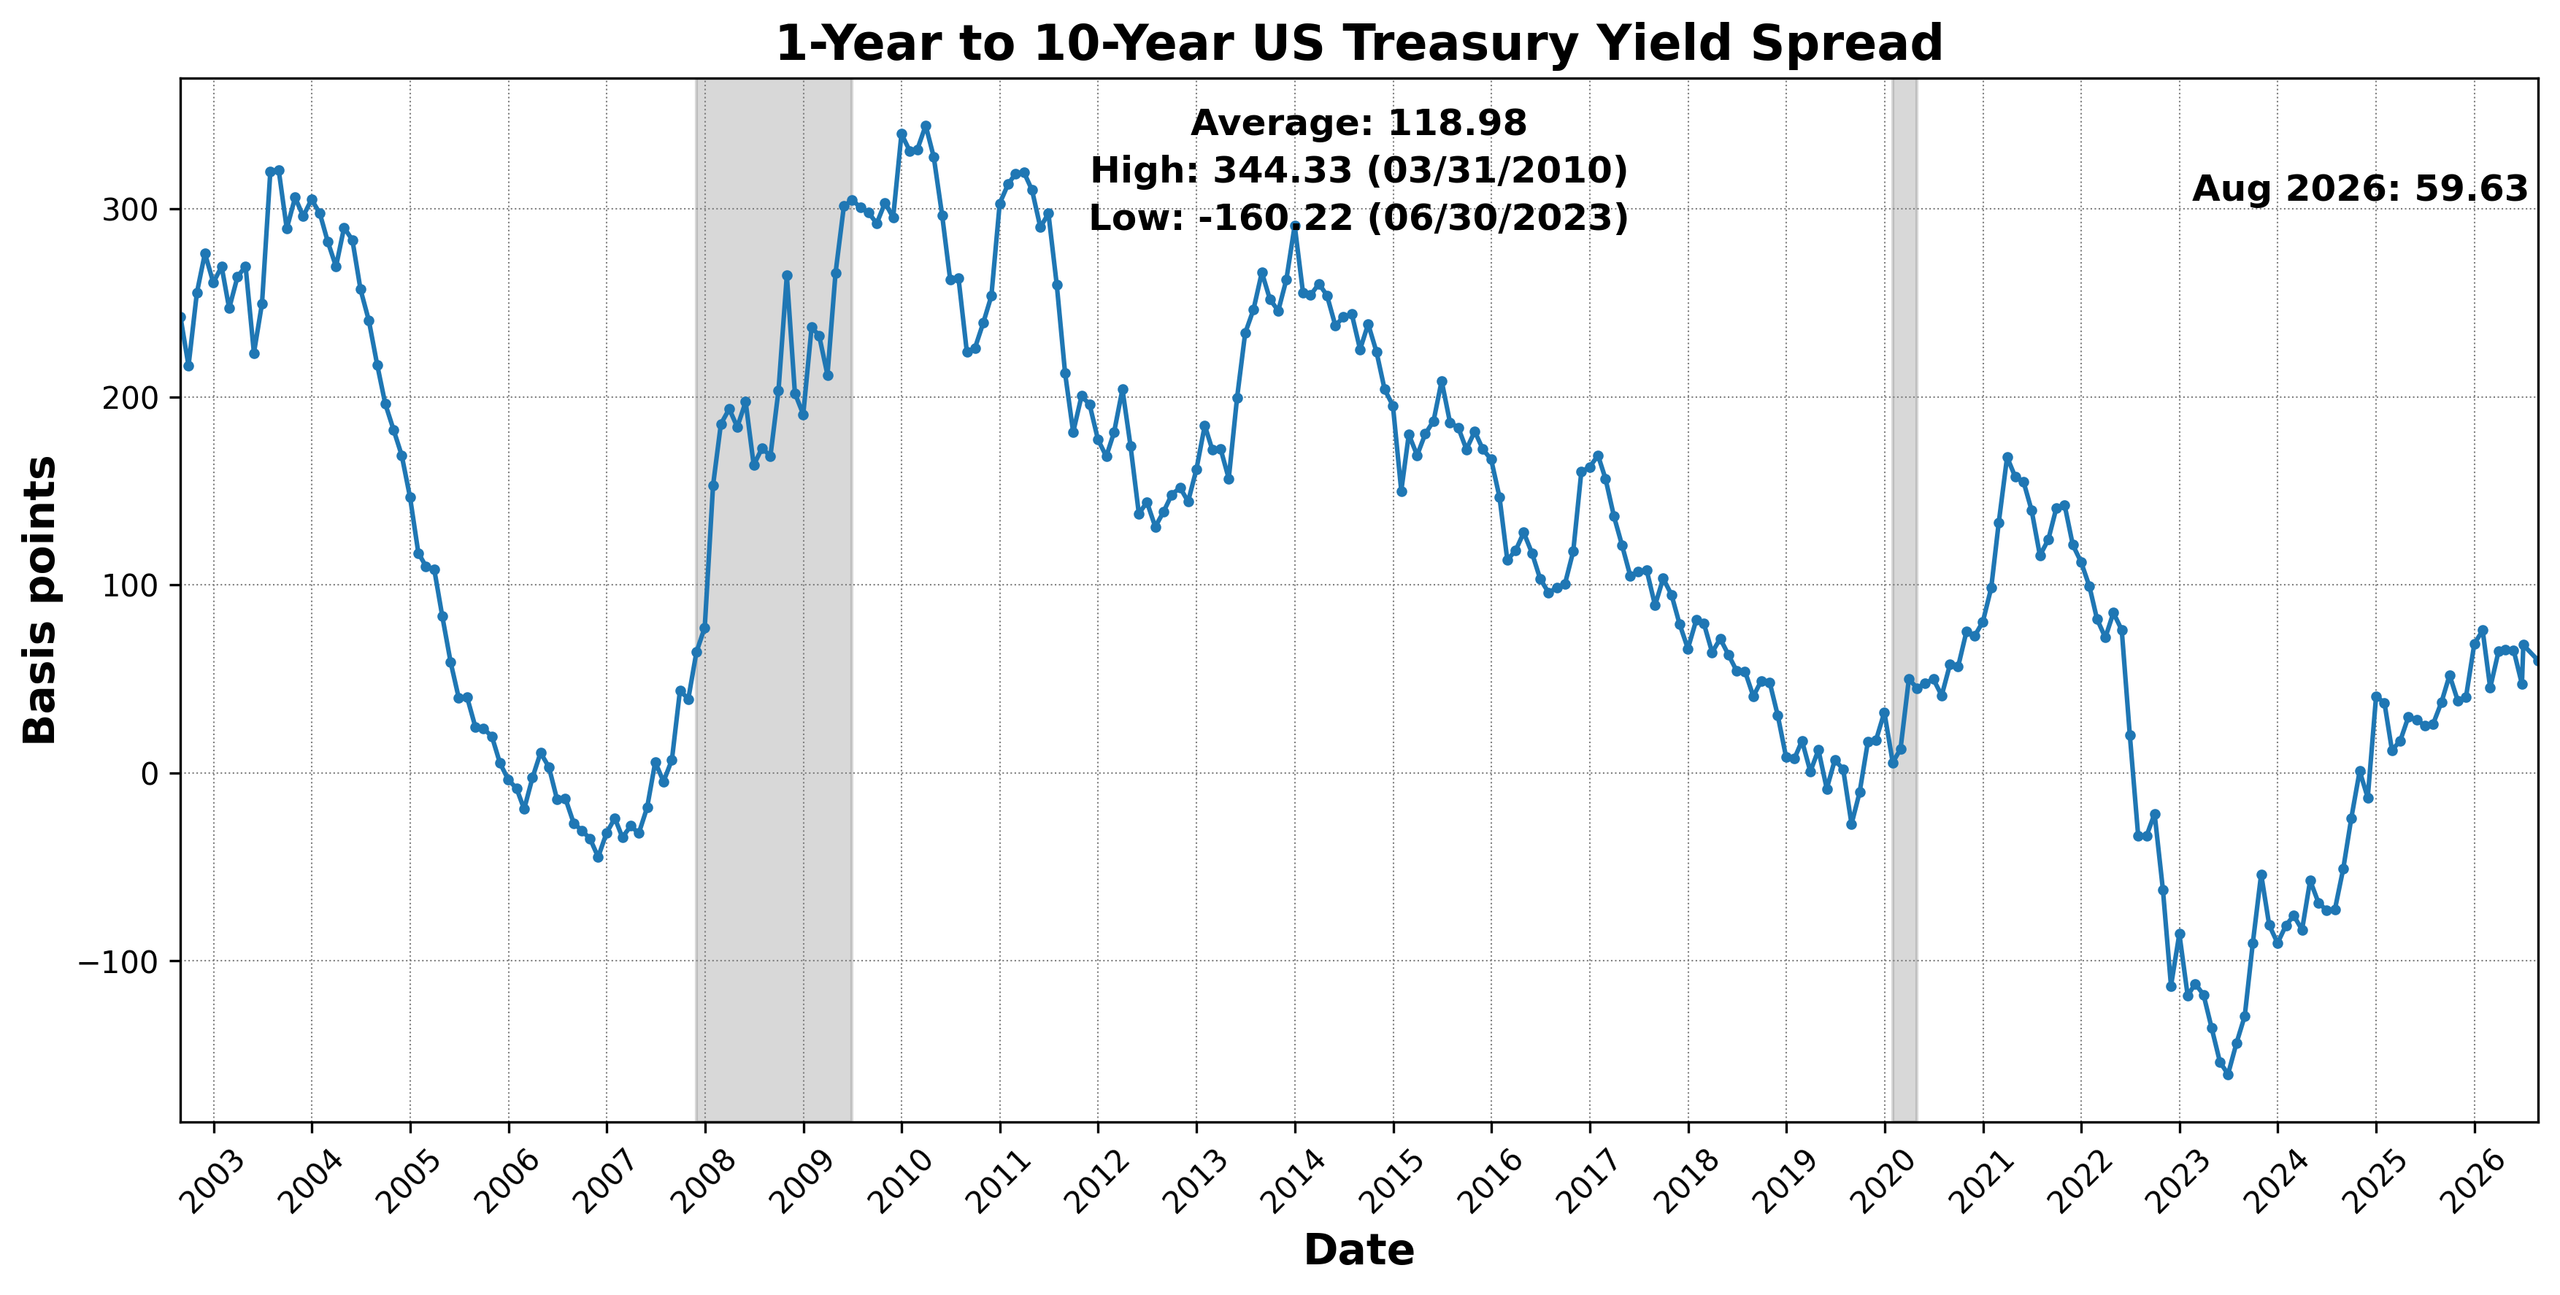
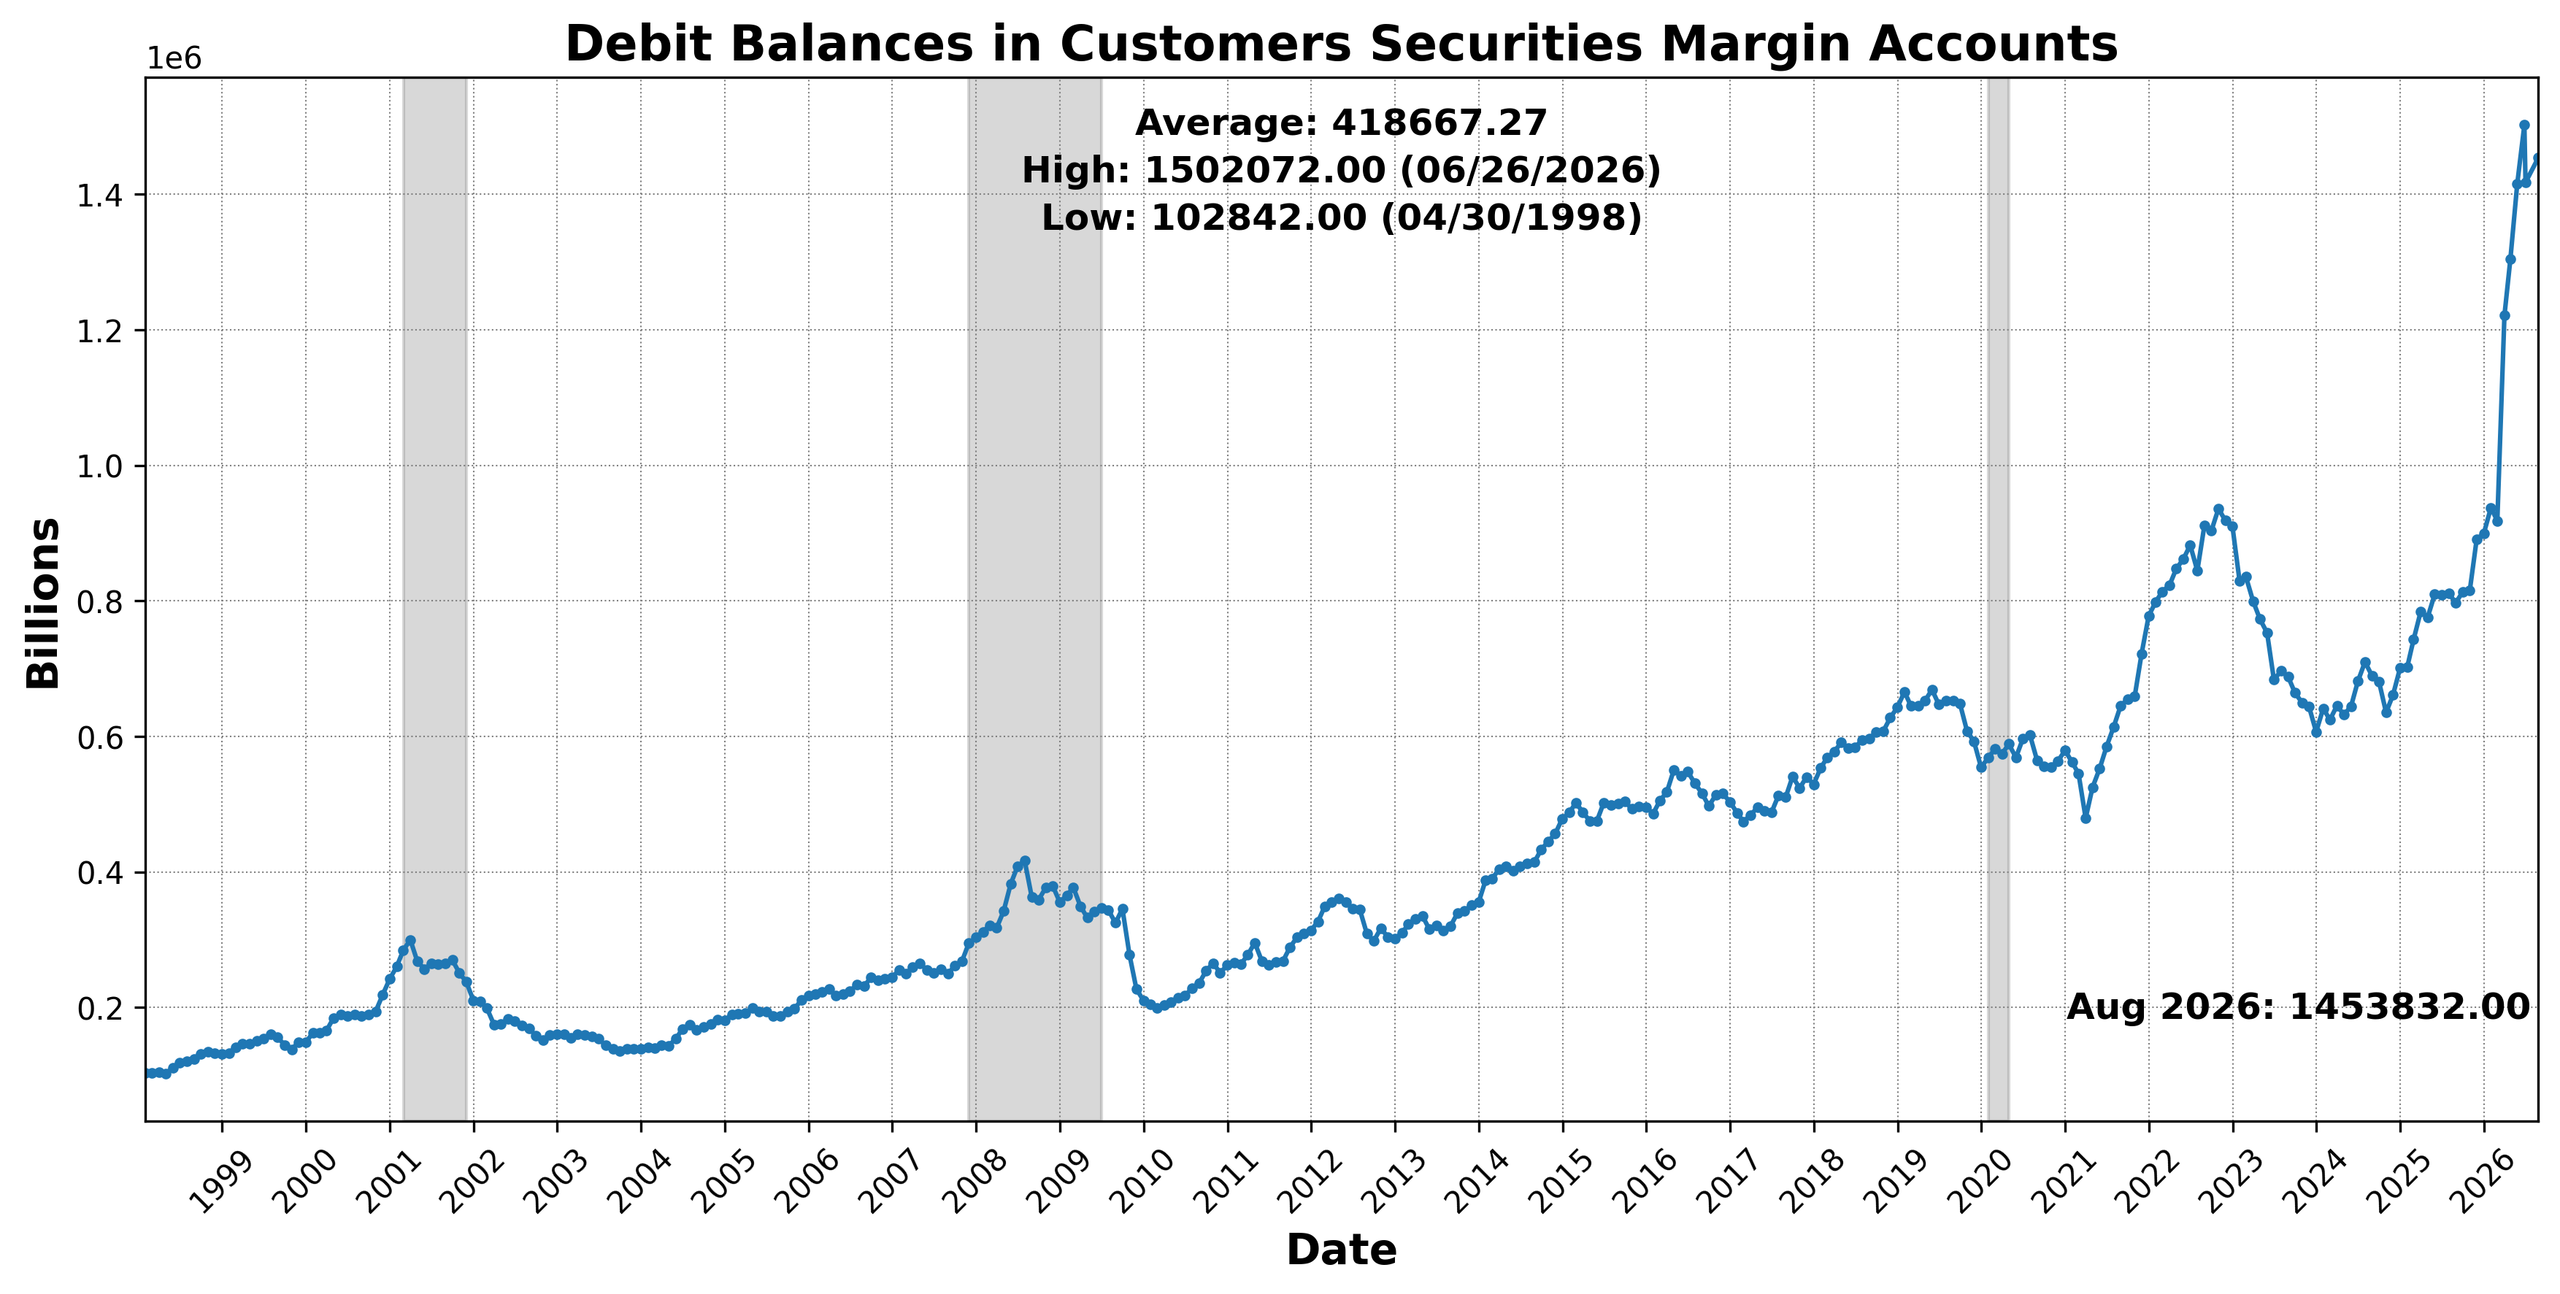
Several measures of financial conditions, spending, and prospective production provided support. The Conference Board US Leading Index Stock Prices 500 Common Stocks increased 3.1 percent, while Debit Balances in Customers’ Securities Margin Accounts rose 2.6 percent. Adjusted Retail and Food Services Sales Total SA advanced 1.3 percent, reversing July’s decline. US Average Weekly Hours All Employees Manufacturing SA increased 0.5 percent, rising from 40.4 to 40.6 hours. Business-investment orders also improved. Conference Board US Manufacturers New Orders Nondefense Capital Goods Ex Aircraft increased 1.2 percent, providing a firmer signal from a measure closely associated with prospective capital spending. The 1-Year to 10-Year US Treasury Yield Spread declined 12.4 percent and contributed positively to the index.
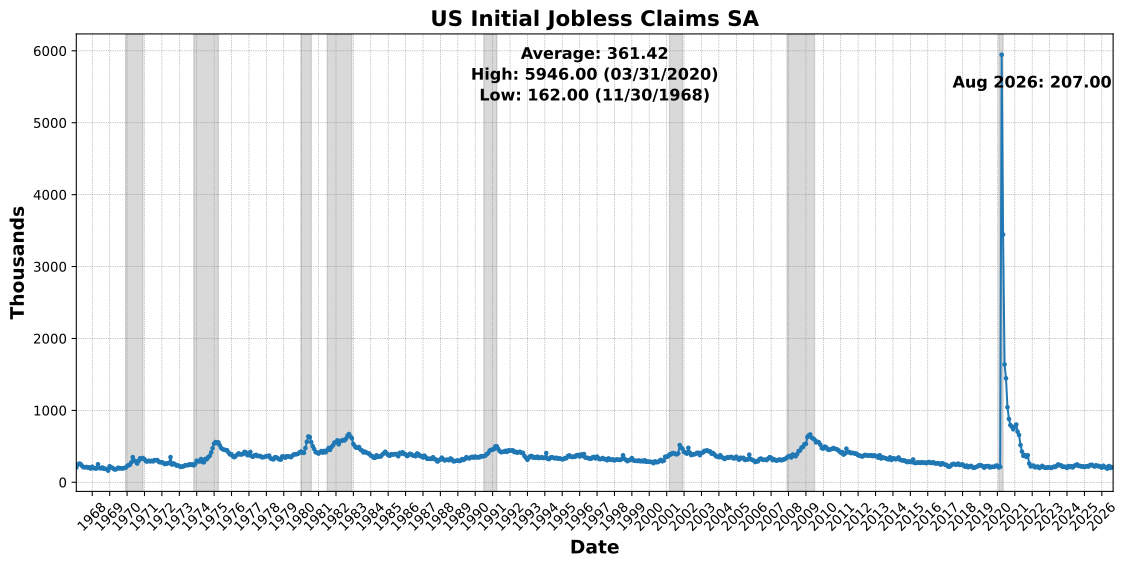
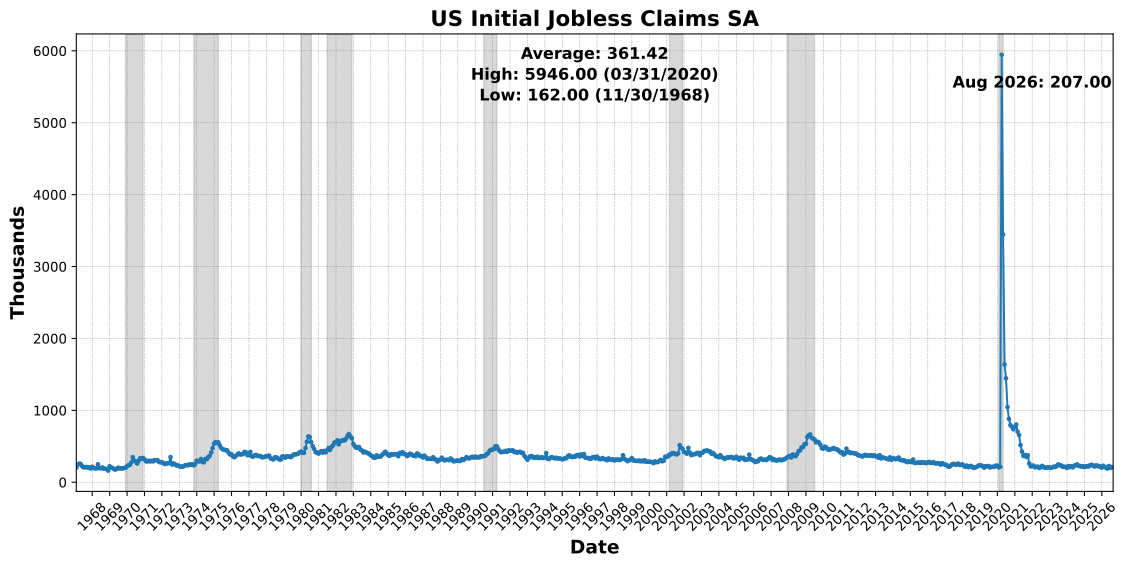
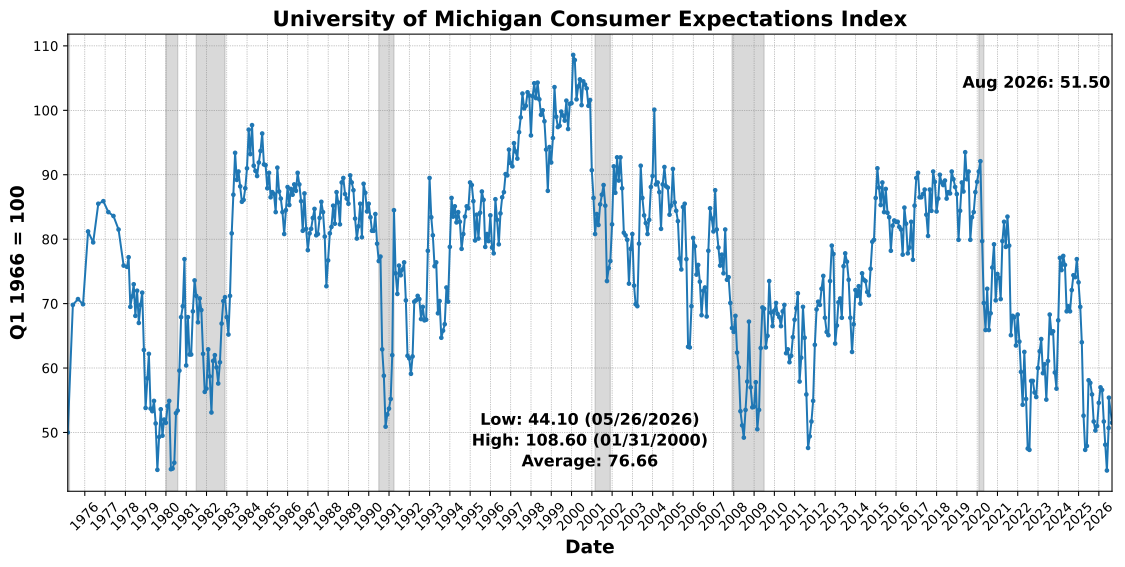
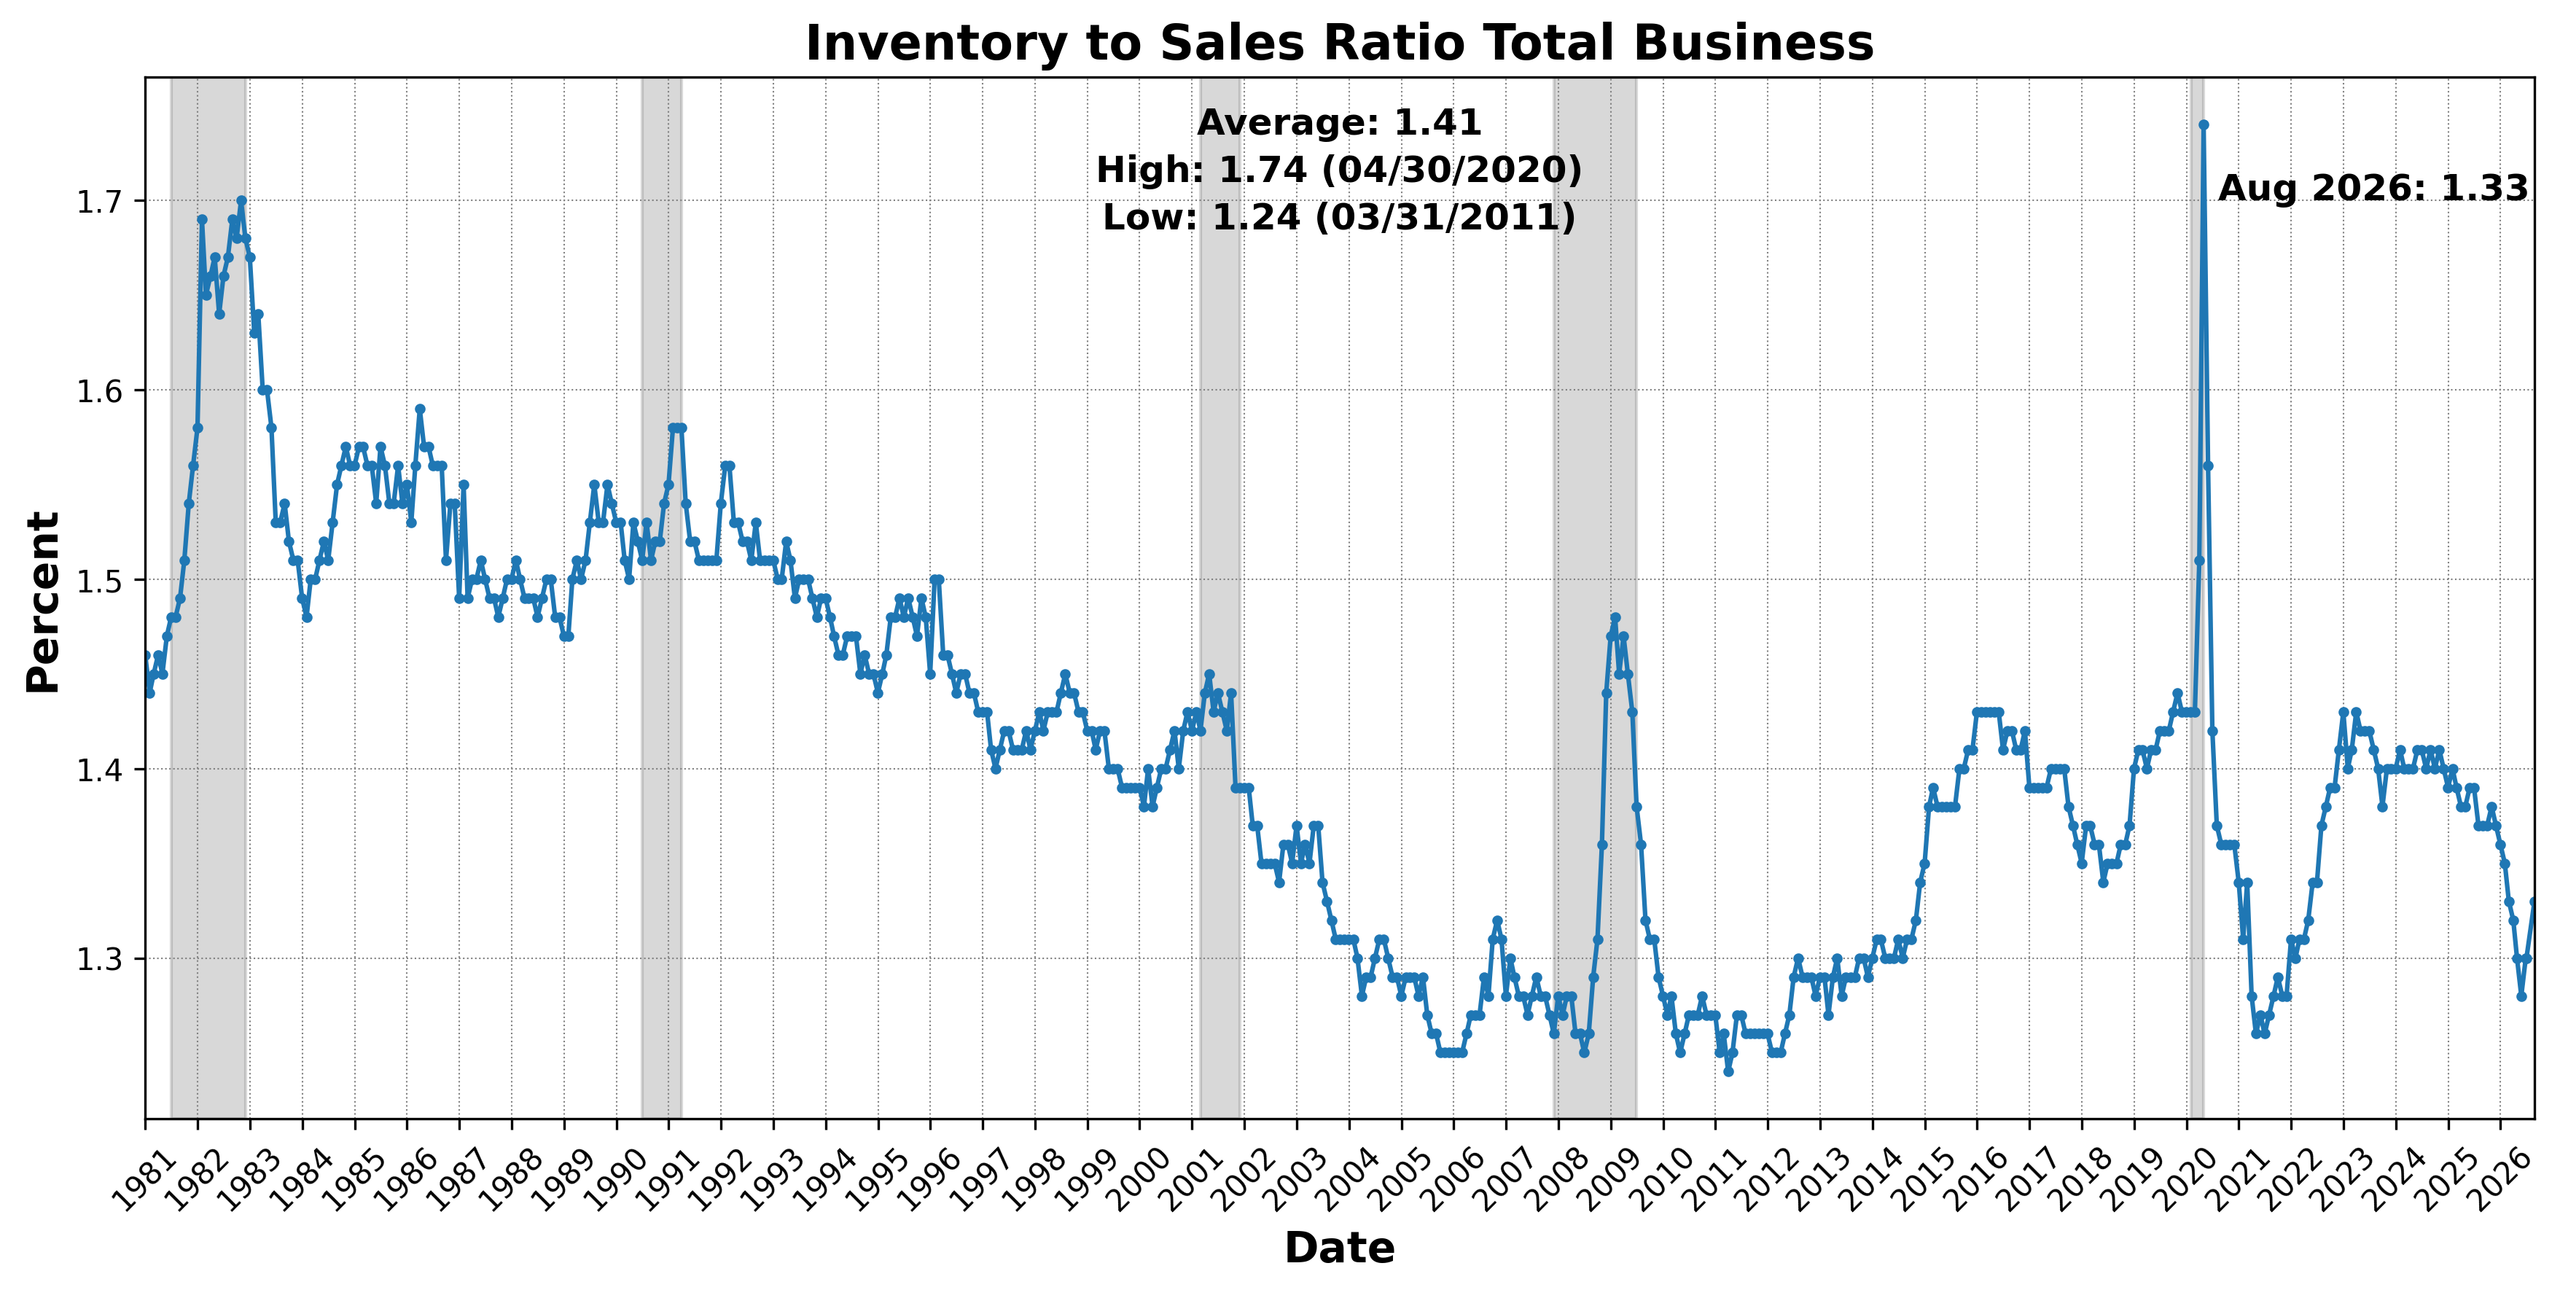
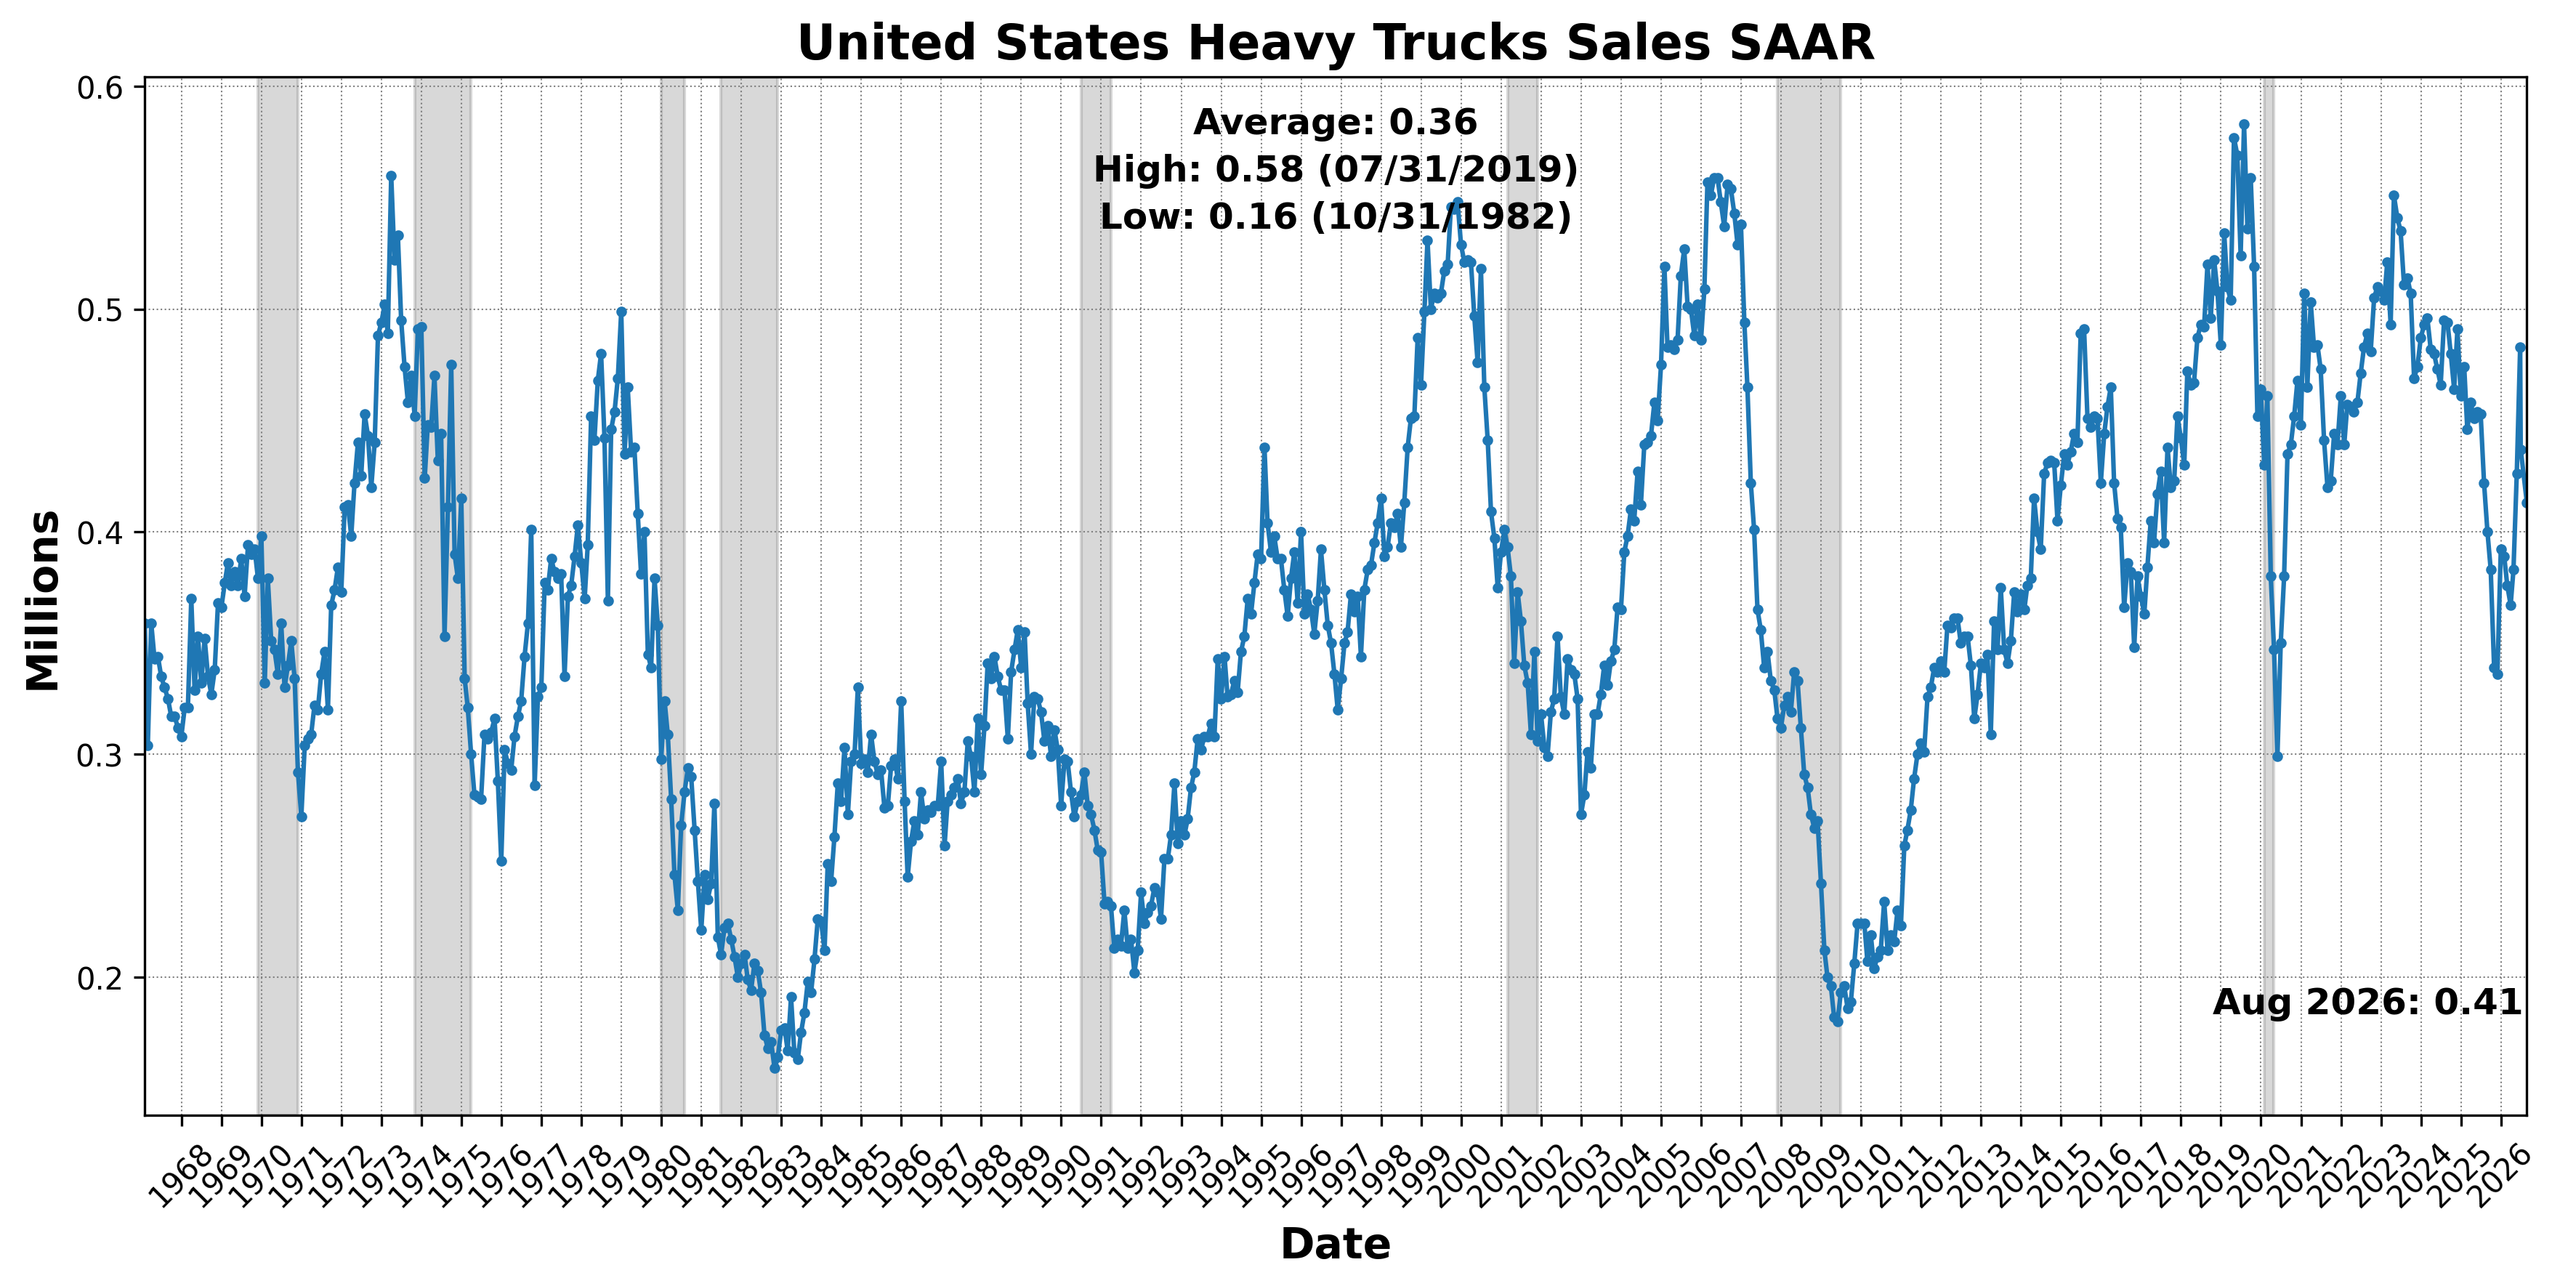
Those gains were matched by weakness elsewhere. The University of Michigan Consumer Expectations Index fell 7.0 percent, from 55.4 to 51.5, reversing July’s improvement. US Initial Jobless Claims SA increased 3.5 percent, indicating a less favorable direction for layoffs than in the previous month. Conference Board US Leading Index Manufacturers’ New Orders Consumer Goods and Materials declined 0.8 percent. Housing and transportation remained weak. US New Privately Owned Housing Units Started by Structure Total SAAR fell 5.9 percent, while United States Heavy Trucks Sales SAAR declined 4.8 percent. Both extended the declines recorded in July. The Inventory-to-Sales Ratio Total Business slipped 0.7 percent and also made a negative contribution.
August therefore restored balance to the leading components rather than establishing broad forward-looking strength. Firmer retail activity, capital-goods orders, manufacturing hours, equity prices, and margin borrowing helped offset continued weakness in housing and heavy truck sales. Yet declining consumer expectations and higher initial claims limited the improvement. The move from 42 to 50 is encouraging relative to July’s setback, but an even division between positive and negative components leaves the outlook unresolved.
ROUGHLY COINCIDENT INDICATOR (83)
The Roughly Coincident Indicator increased to 83 from July’s reading of 67. Five of six components improved, with one declining and none unchanged.
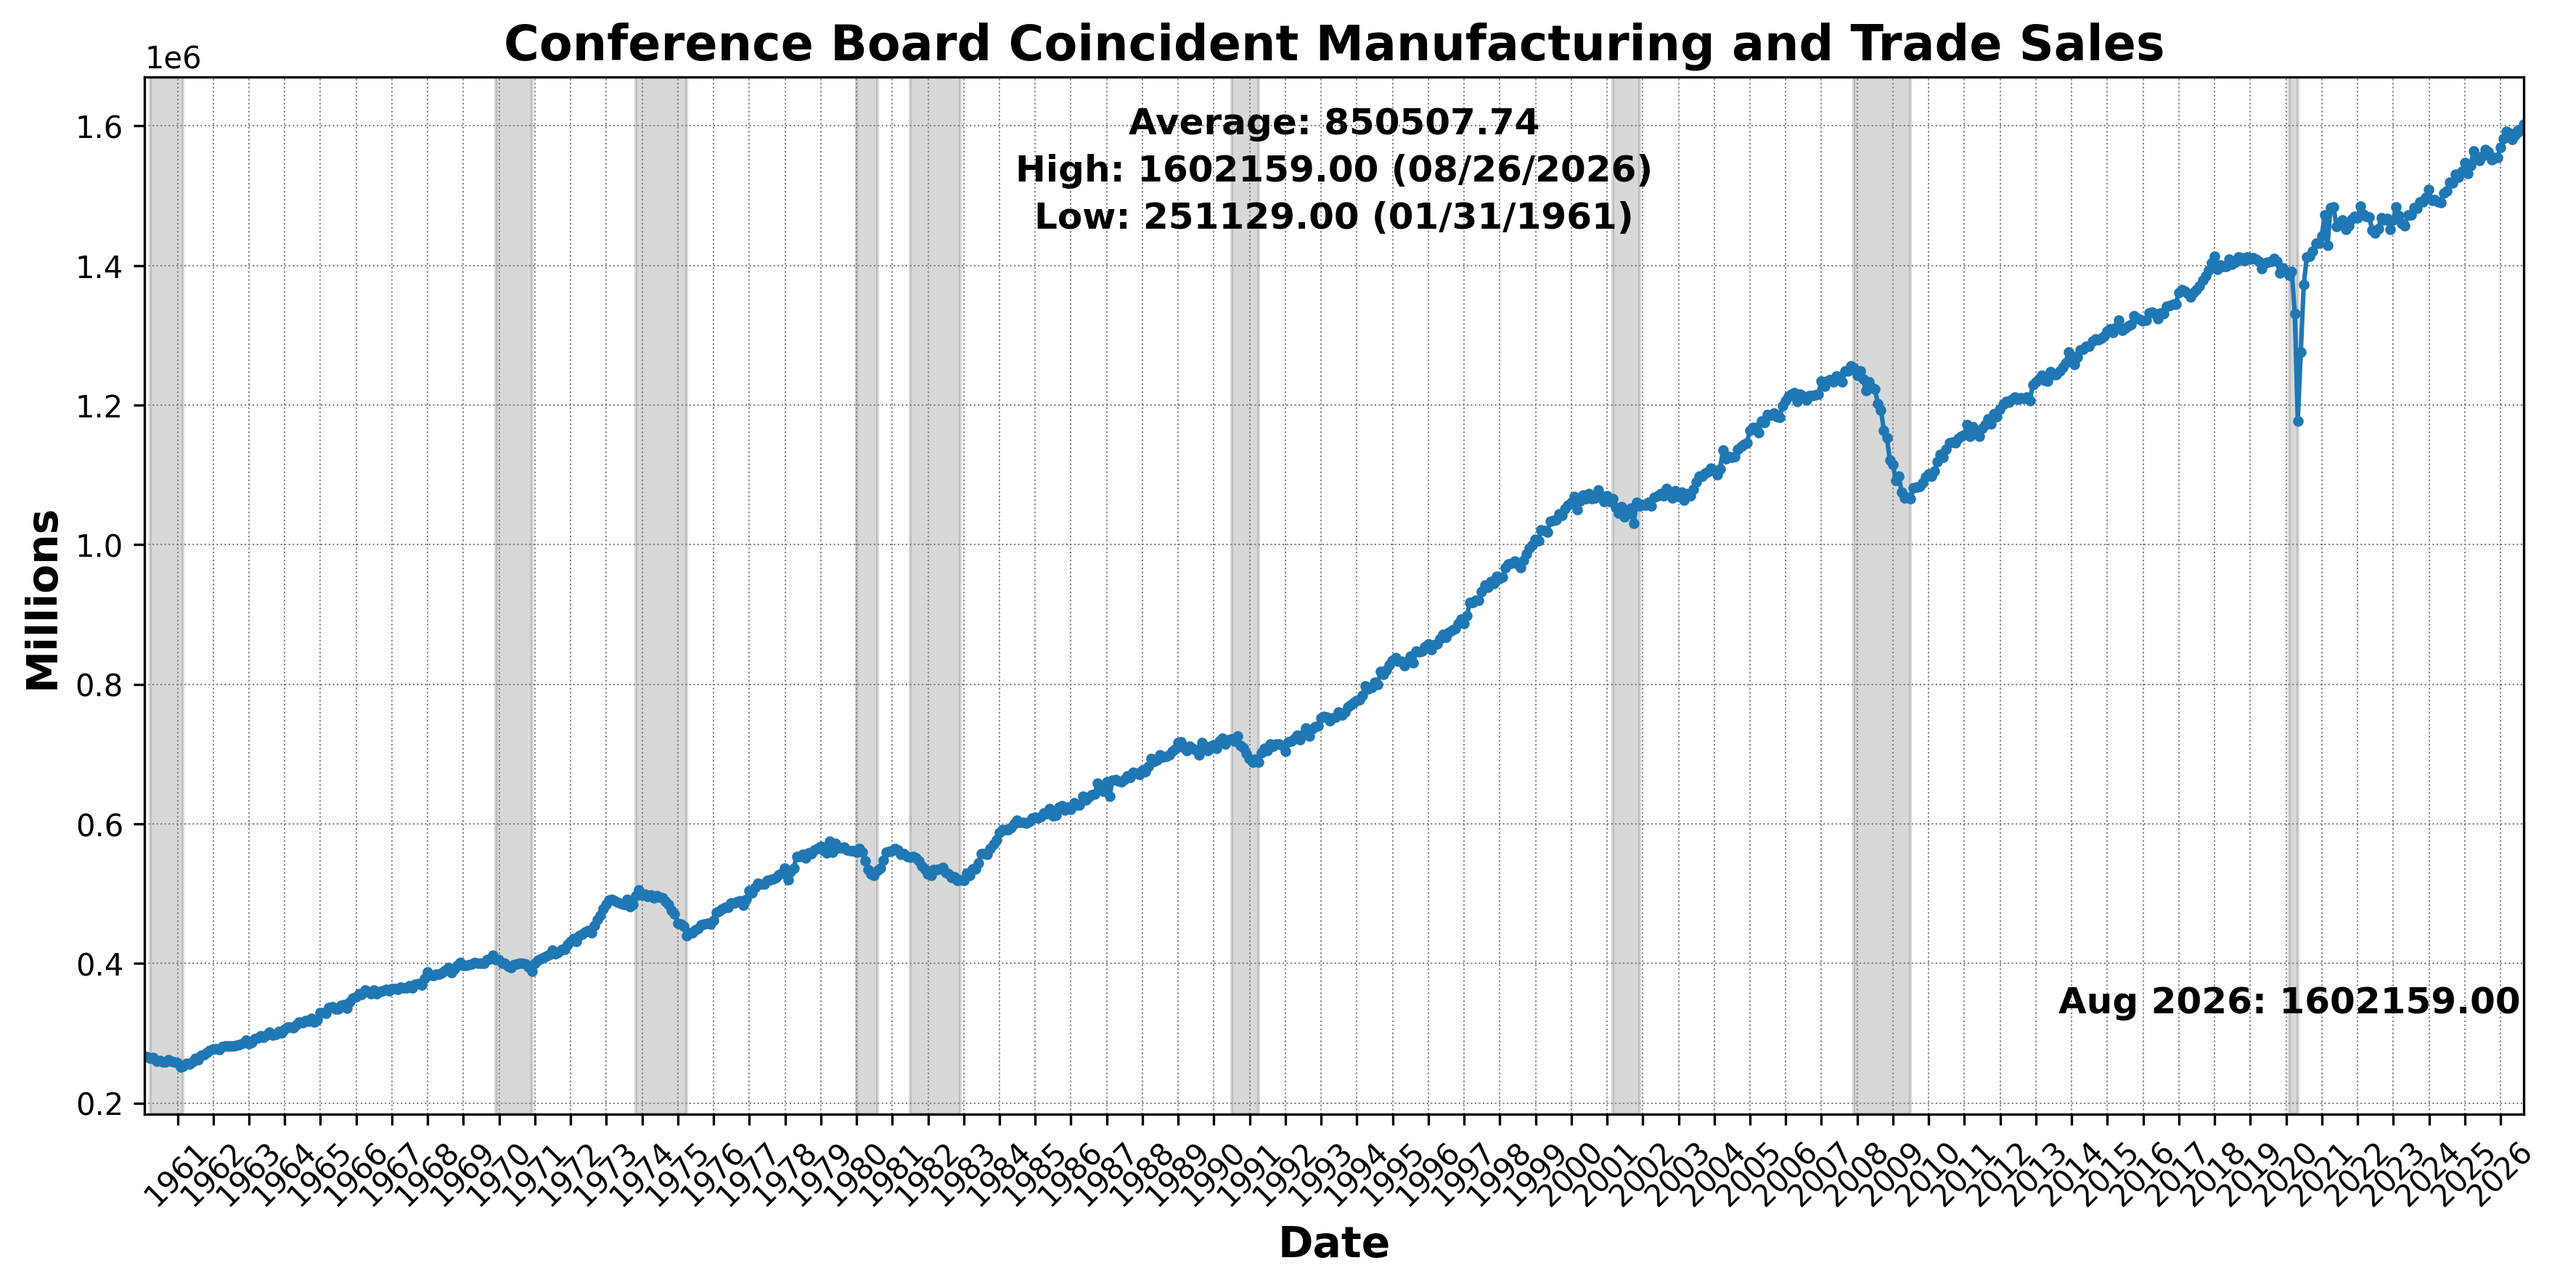
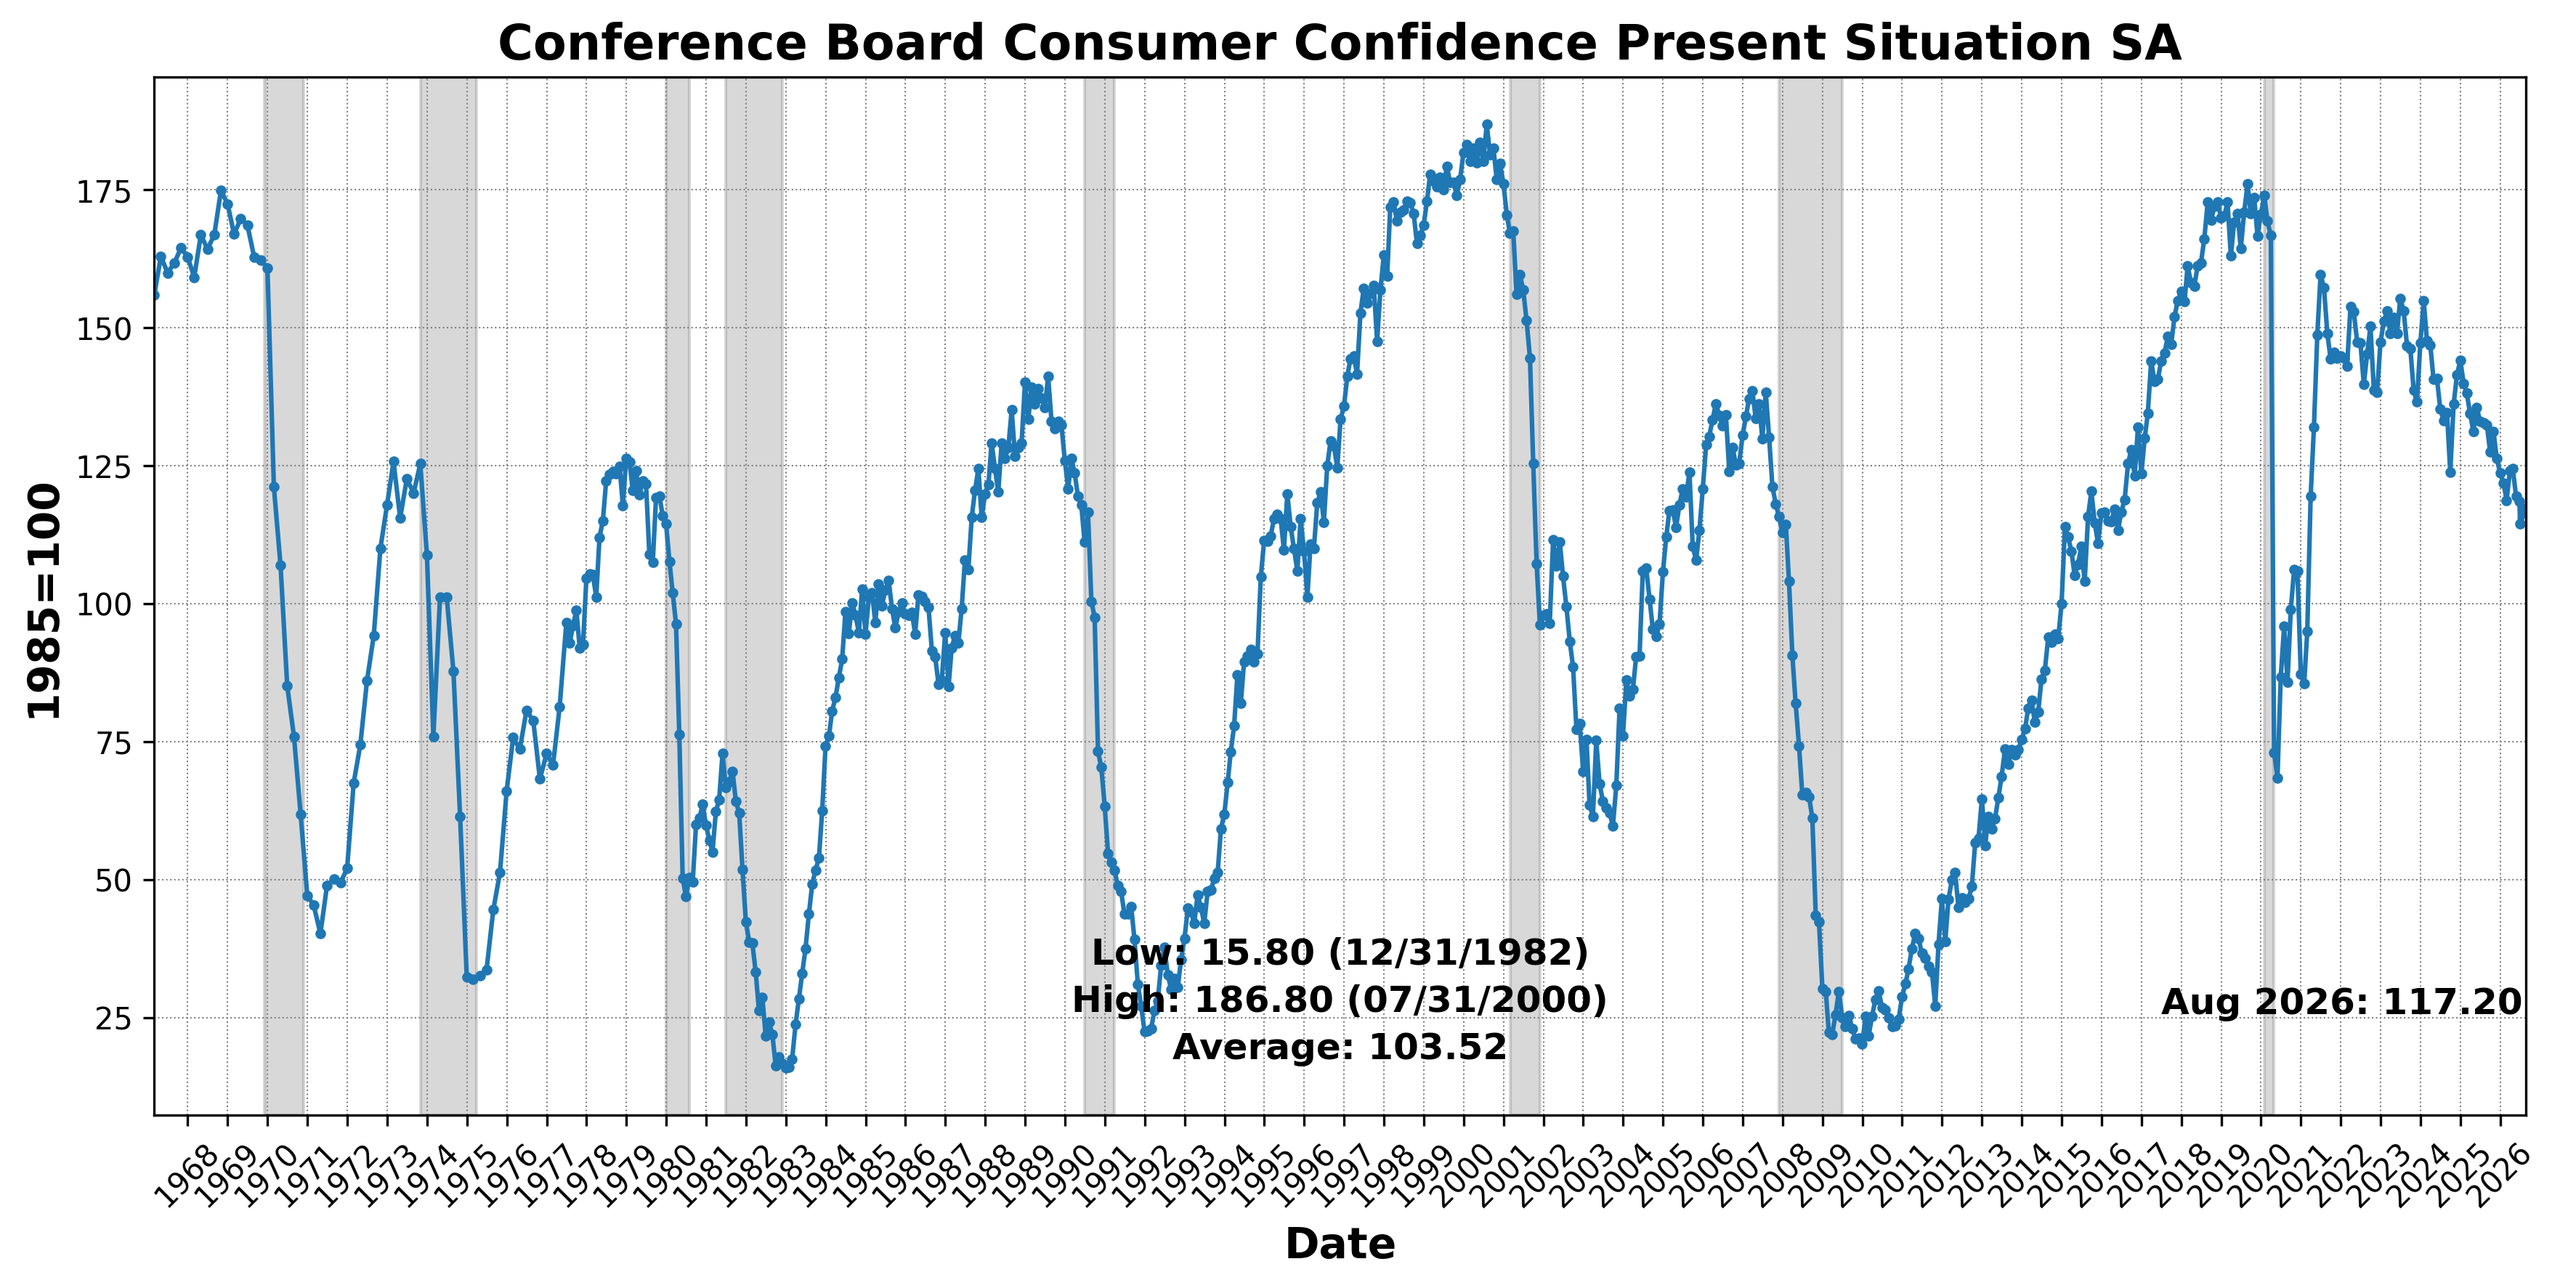
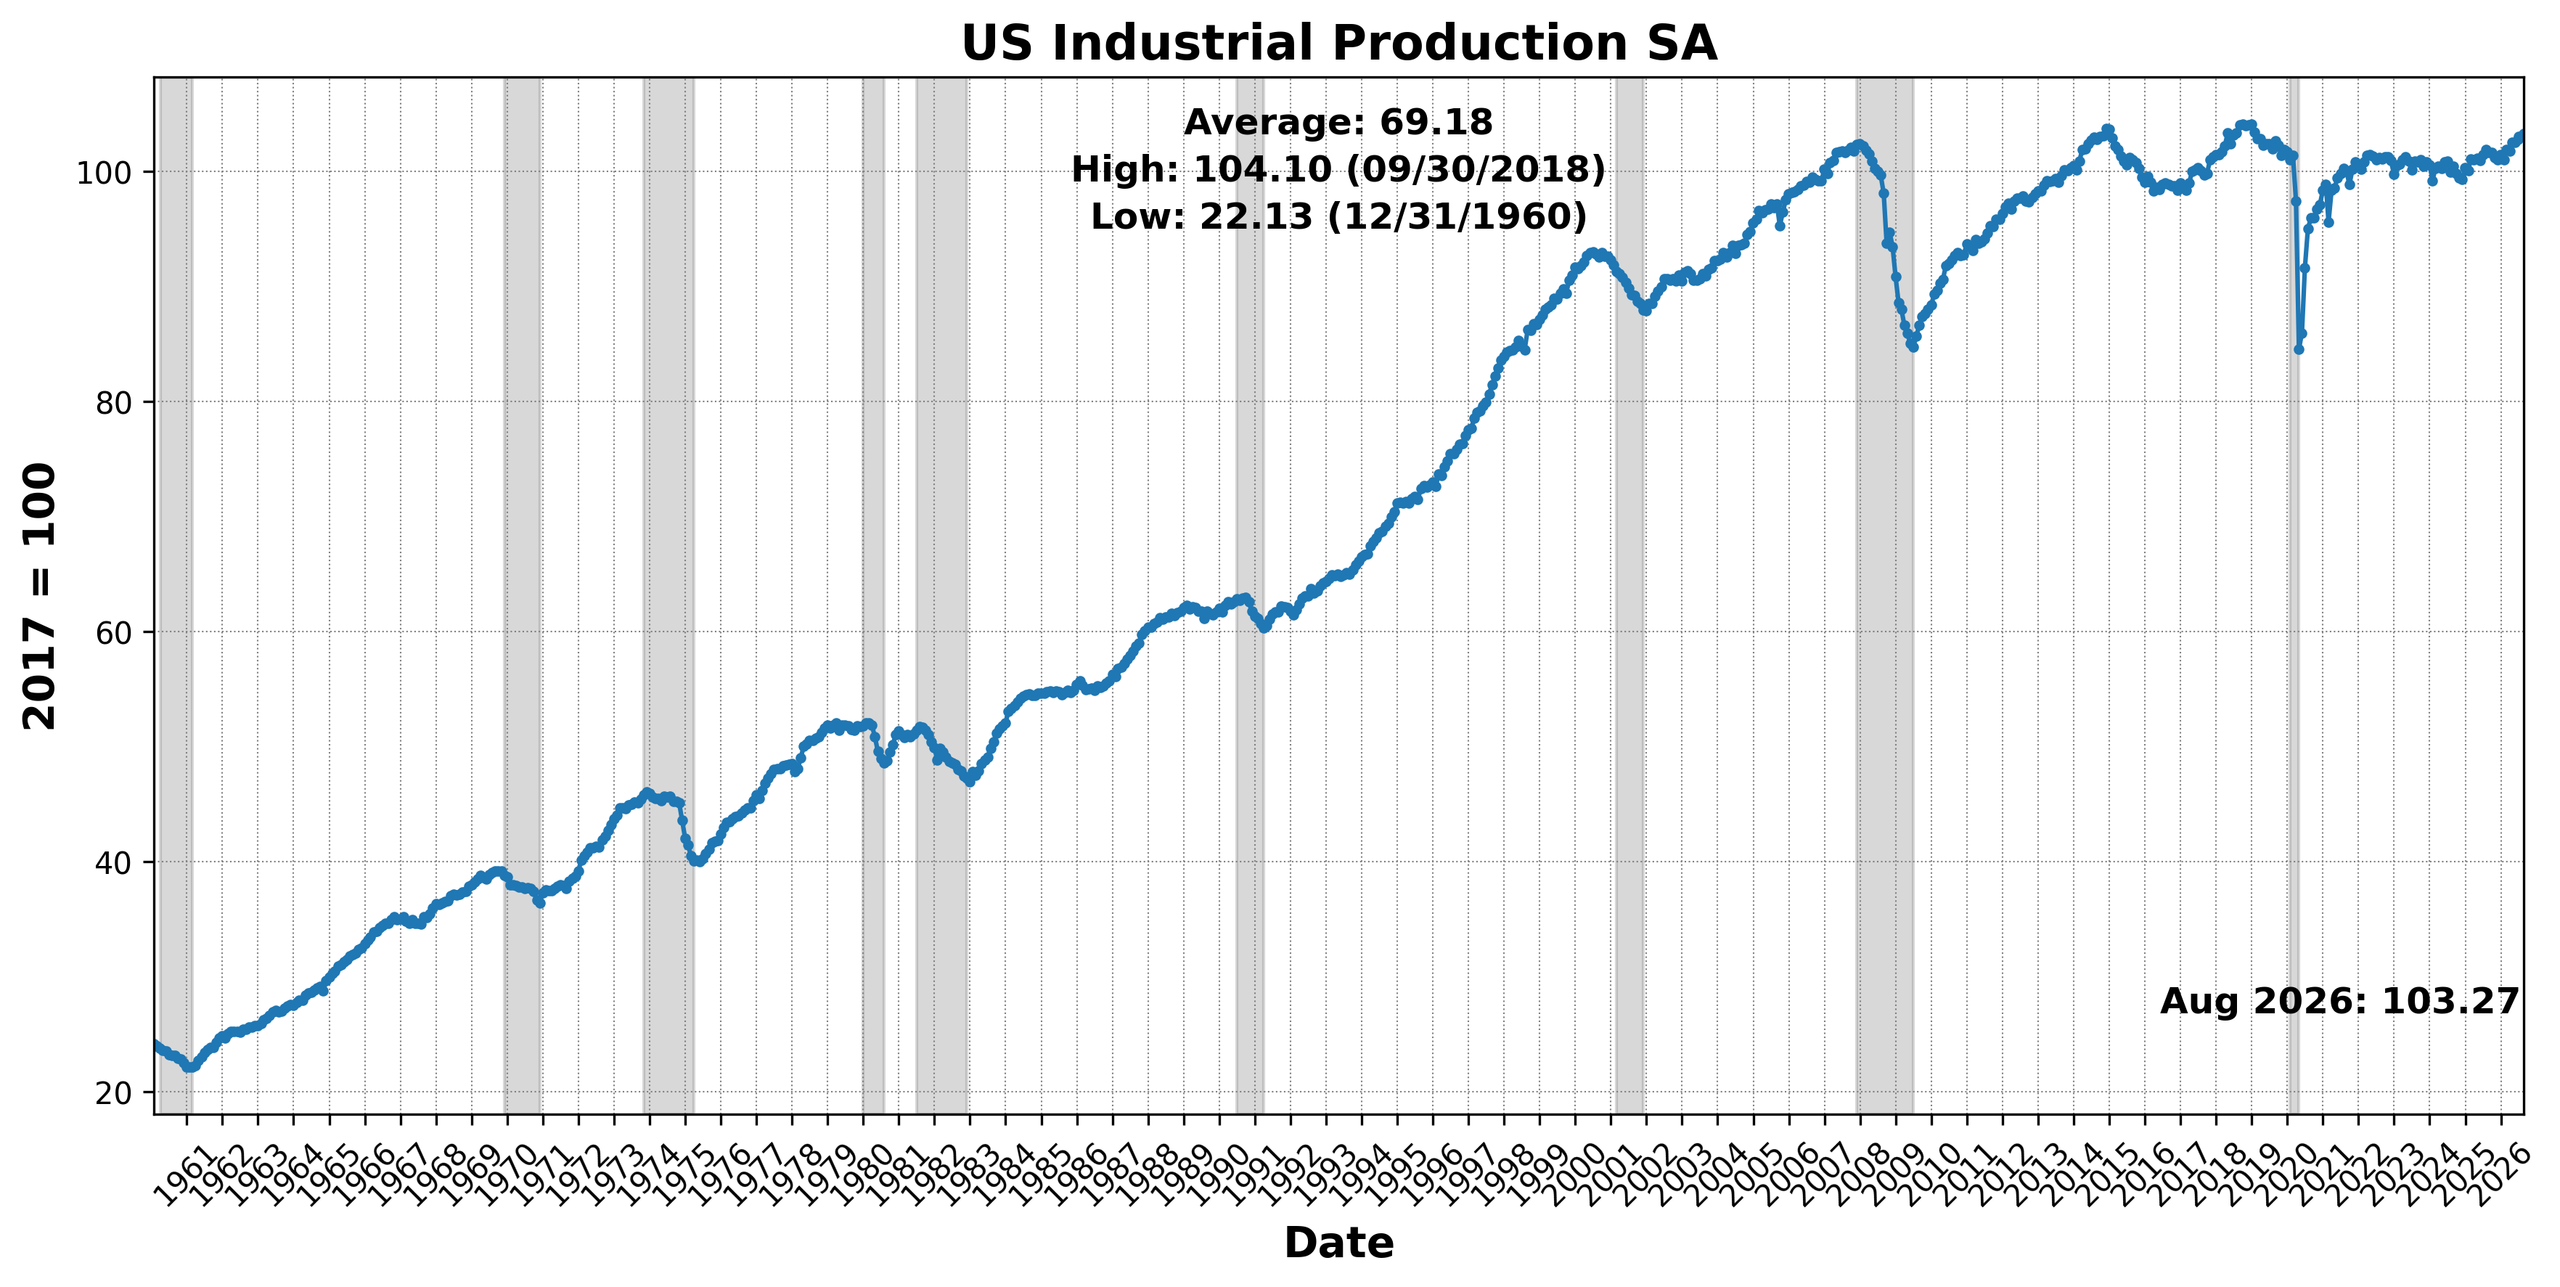
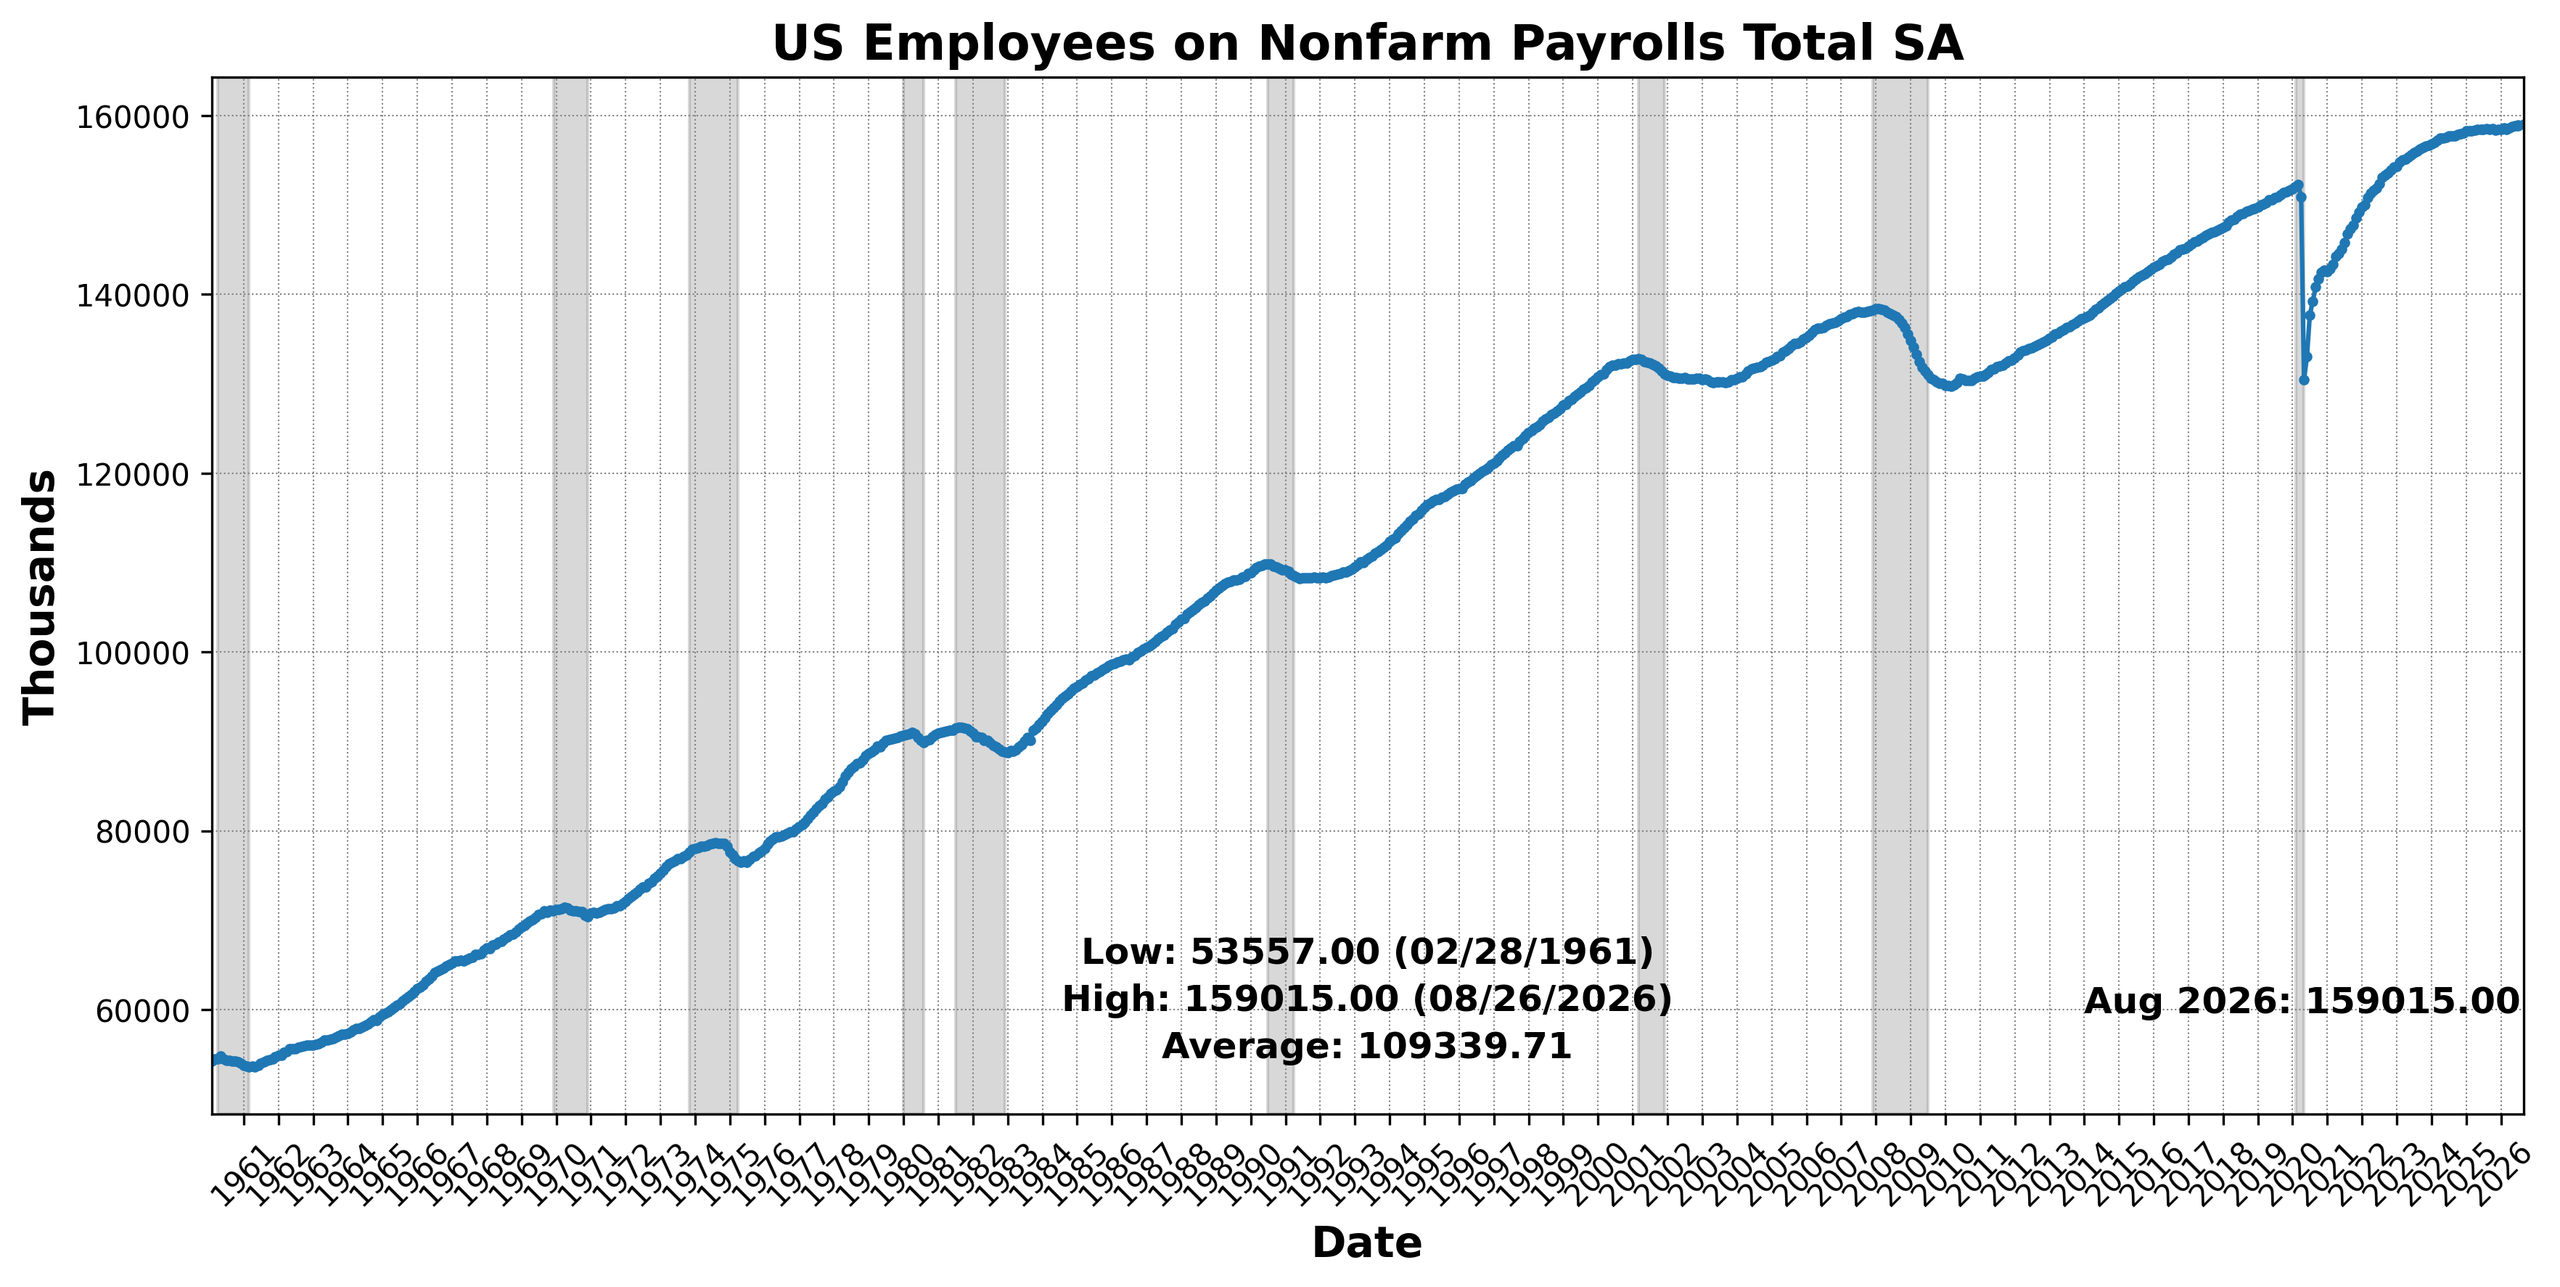
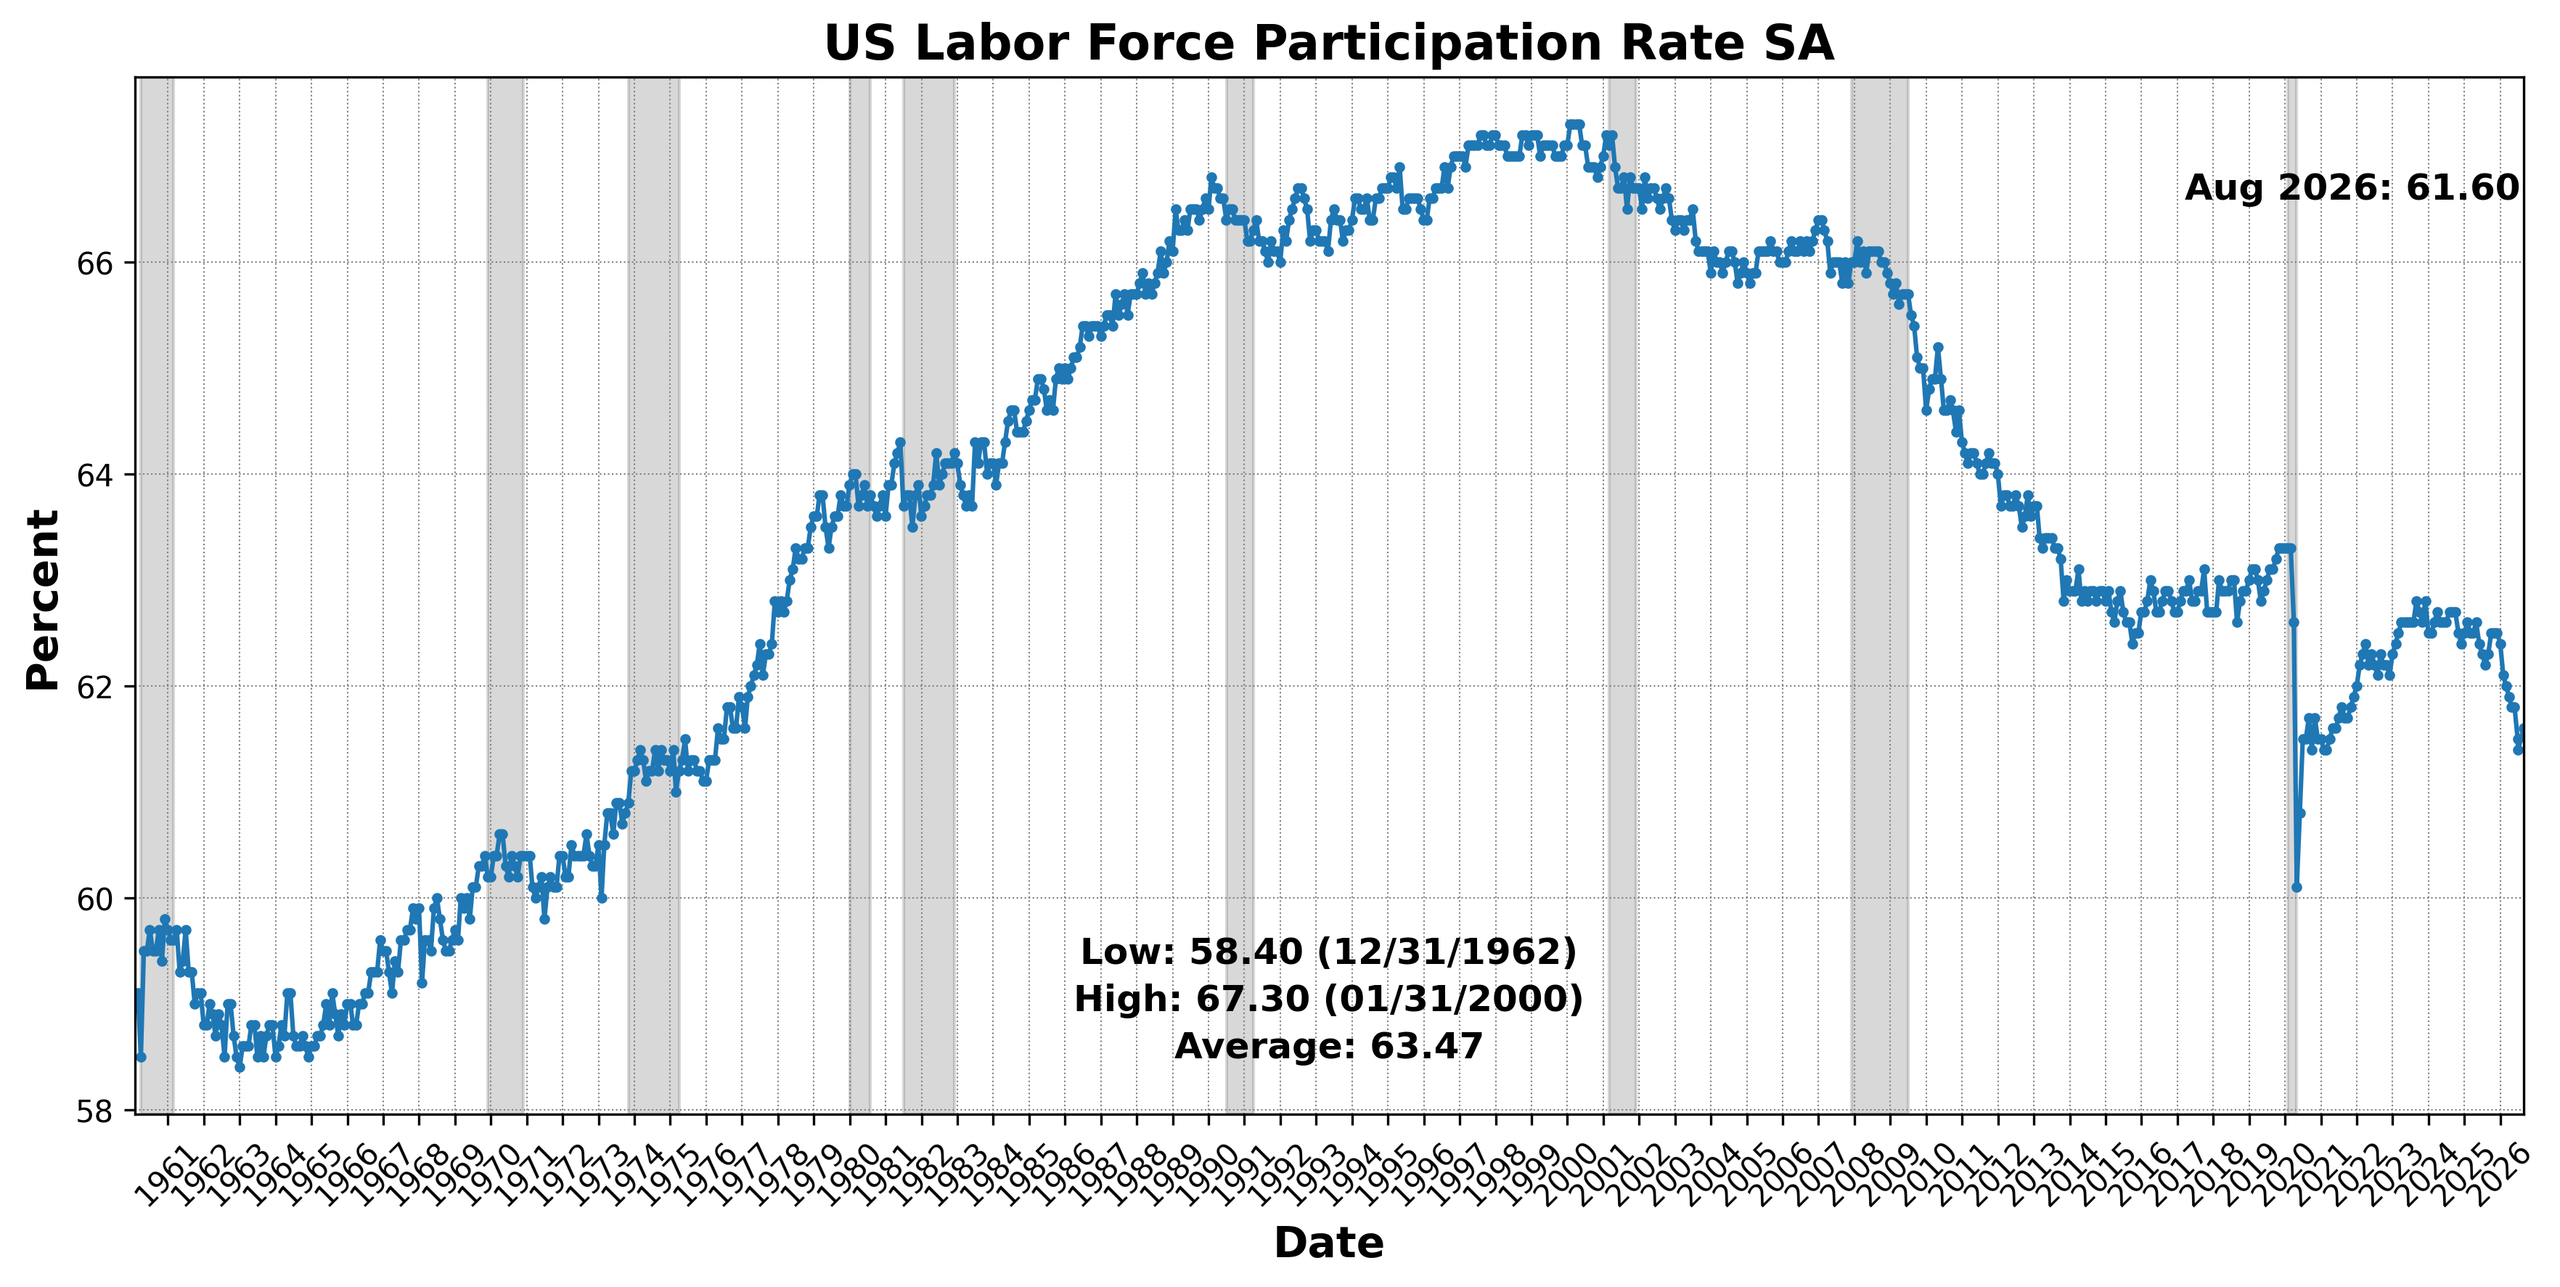
The gains extended across sales, production, employment, participation, and consumer assessments of current conditions. Conference Board Coincident Manufacturing and Trade Sales increased 0.2 percent. Conference Board Consumer Confidence Present Situation SA rose 2.4 percent, from 114.4 to 117.2, recovering some of July’s decline. US Industrial Production SA edged up 0.06 percent, while US Employees on Nonfarm Payrolls Total SA increased 0.08 percent. Both increases were modest but exceeded the BCM’s positive-scoring threshold. The US Labor Force Participation Rate SA rose from 61.4 percent to 61.6 percent, an increase of 0.2 percentage points.
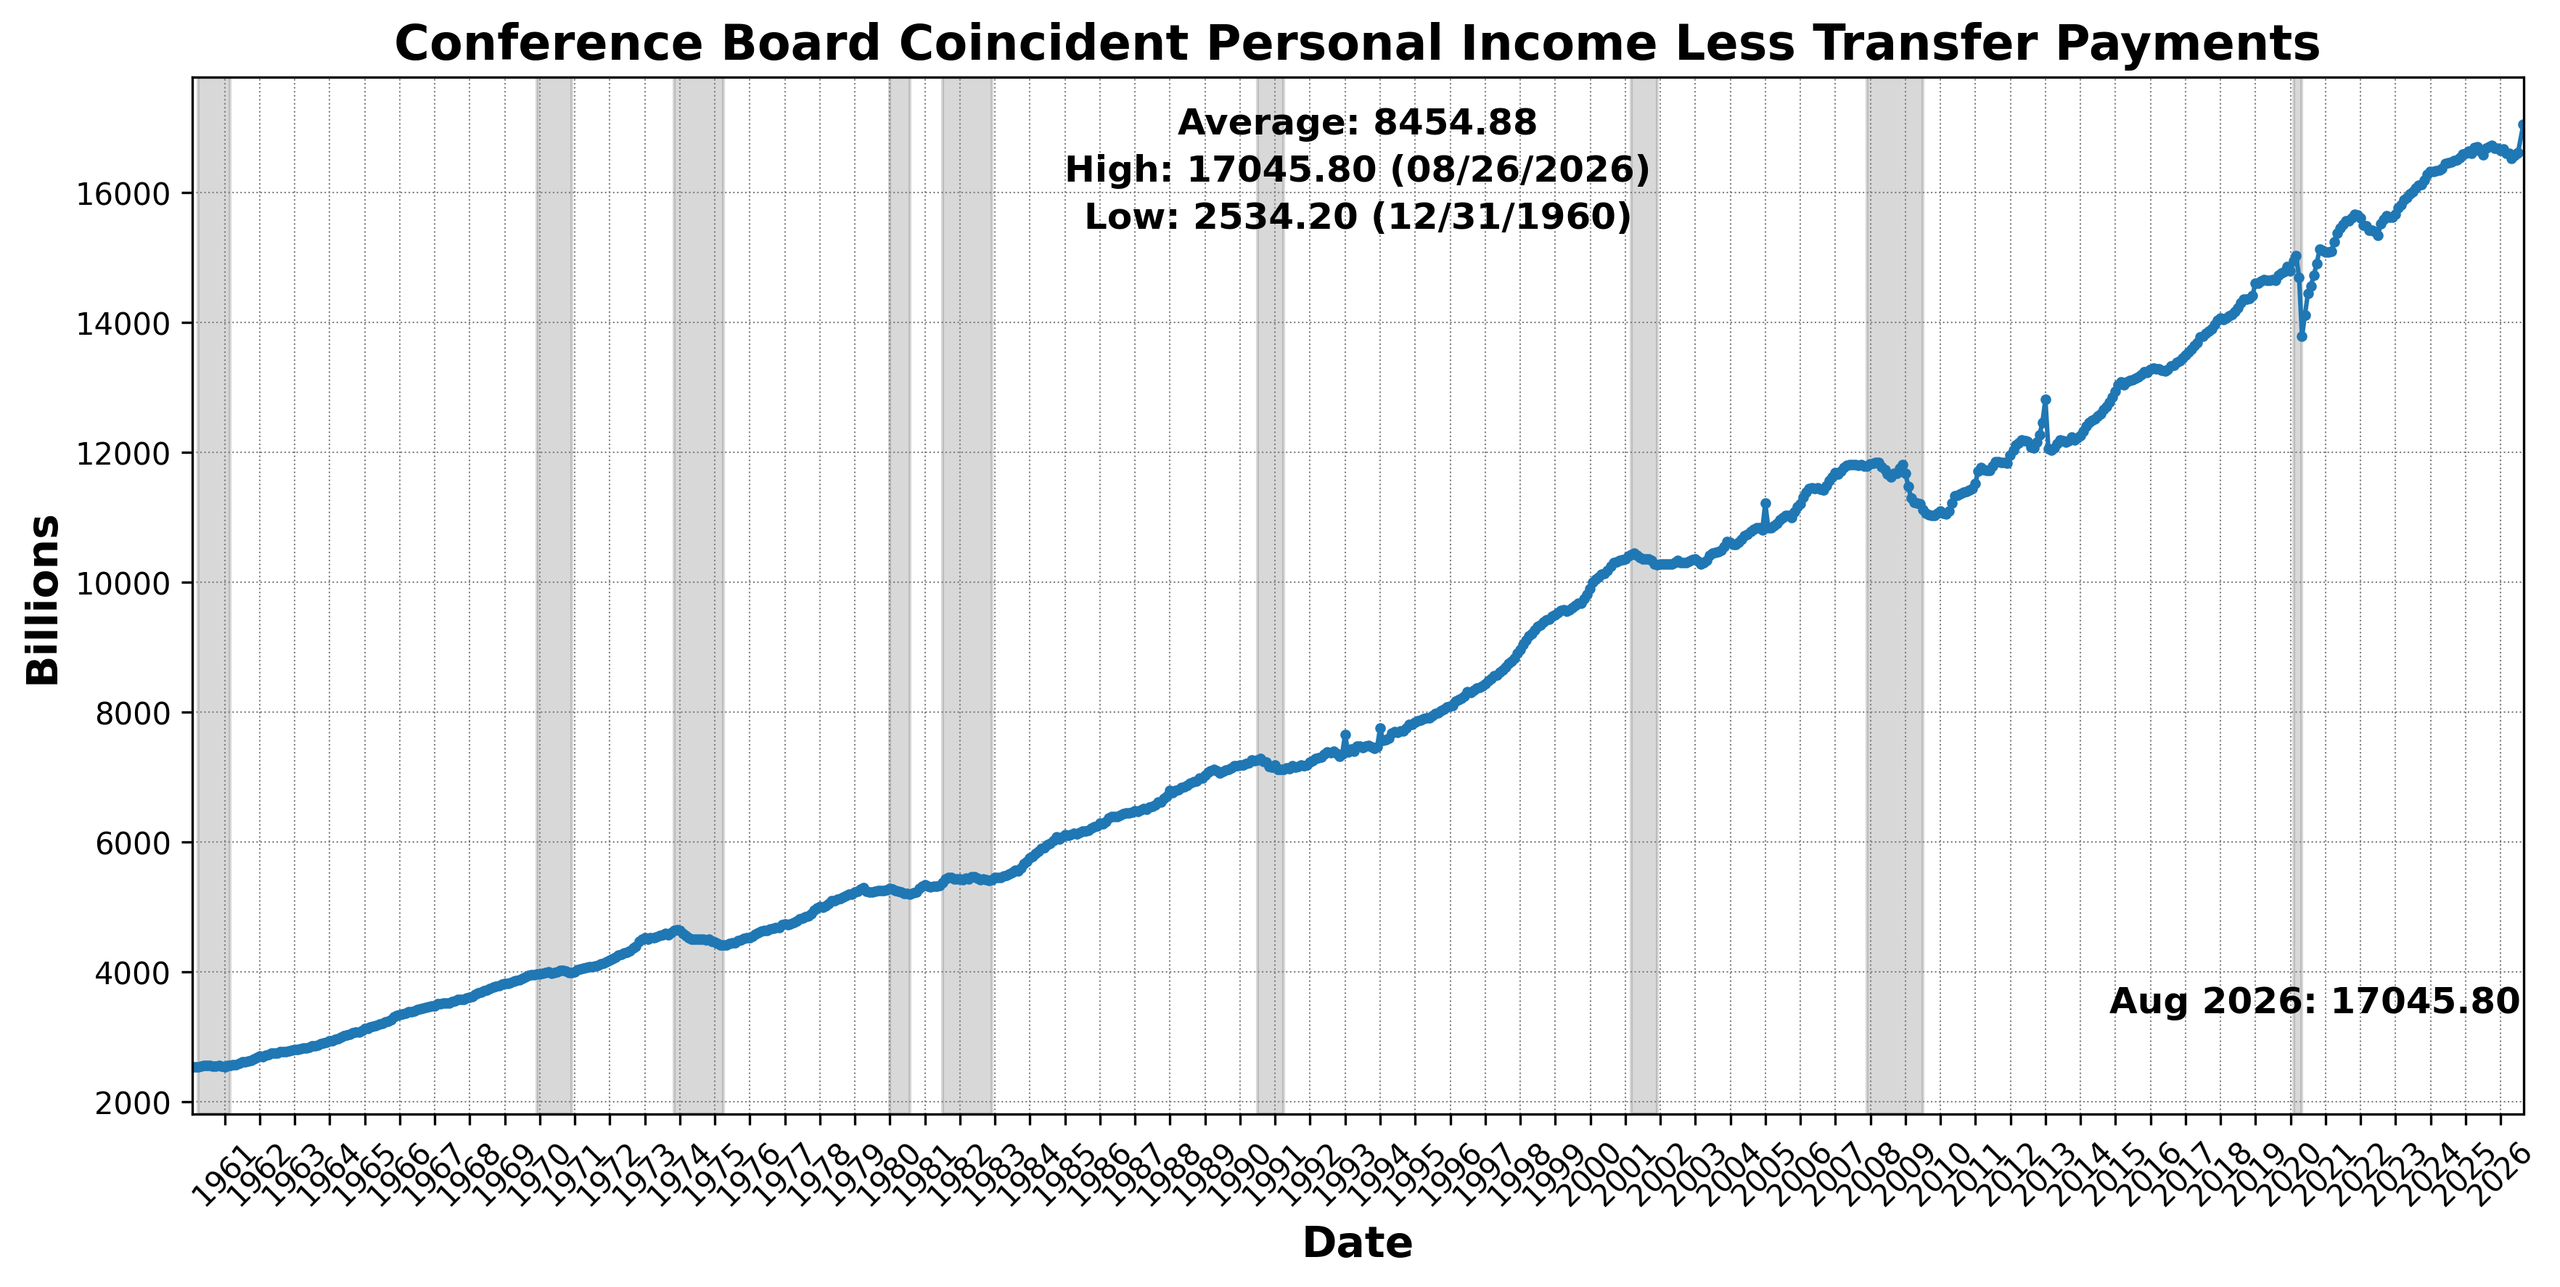
The sole declining component was Conference Board Coincident Personal Income Less Transfer Payments, which slipped 0.08 percent. That decrease was small but outside the neutral band, making it a negative contribution rather than an unchanged reading.
The August coincident results indicate a broader improvement in current activity than the leading measures suggest for the outlook. Production, payroll employment, sales, participation, and present-situation confidence all moved higher. The strength of the diffusion reading should nevertheless be distinguished from the magnitude of those increases: industrial production and payroll growth were slight. An index reading of 83 signals widespread positive direction among the components, not rapid growth across the economy. The decline in income excluding transfers also tempers an otherwise firmer current-conditions picture.
LAGGING INDICATOR (67)
The Lagging Indicator held at 67, with four of six components contributing positively and two negatively. Although the headline reading was unchanged, the composition of its support shifted.
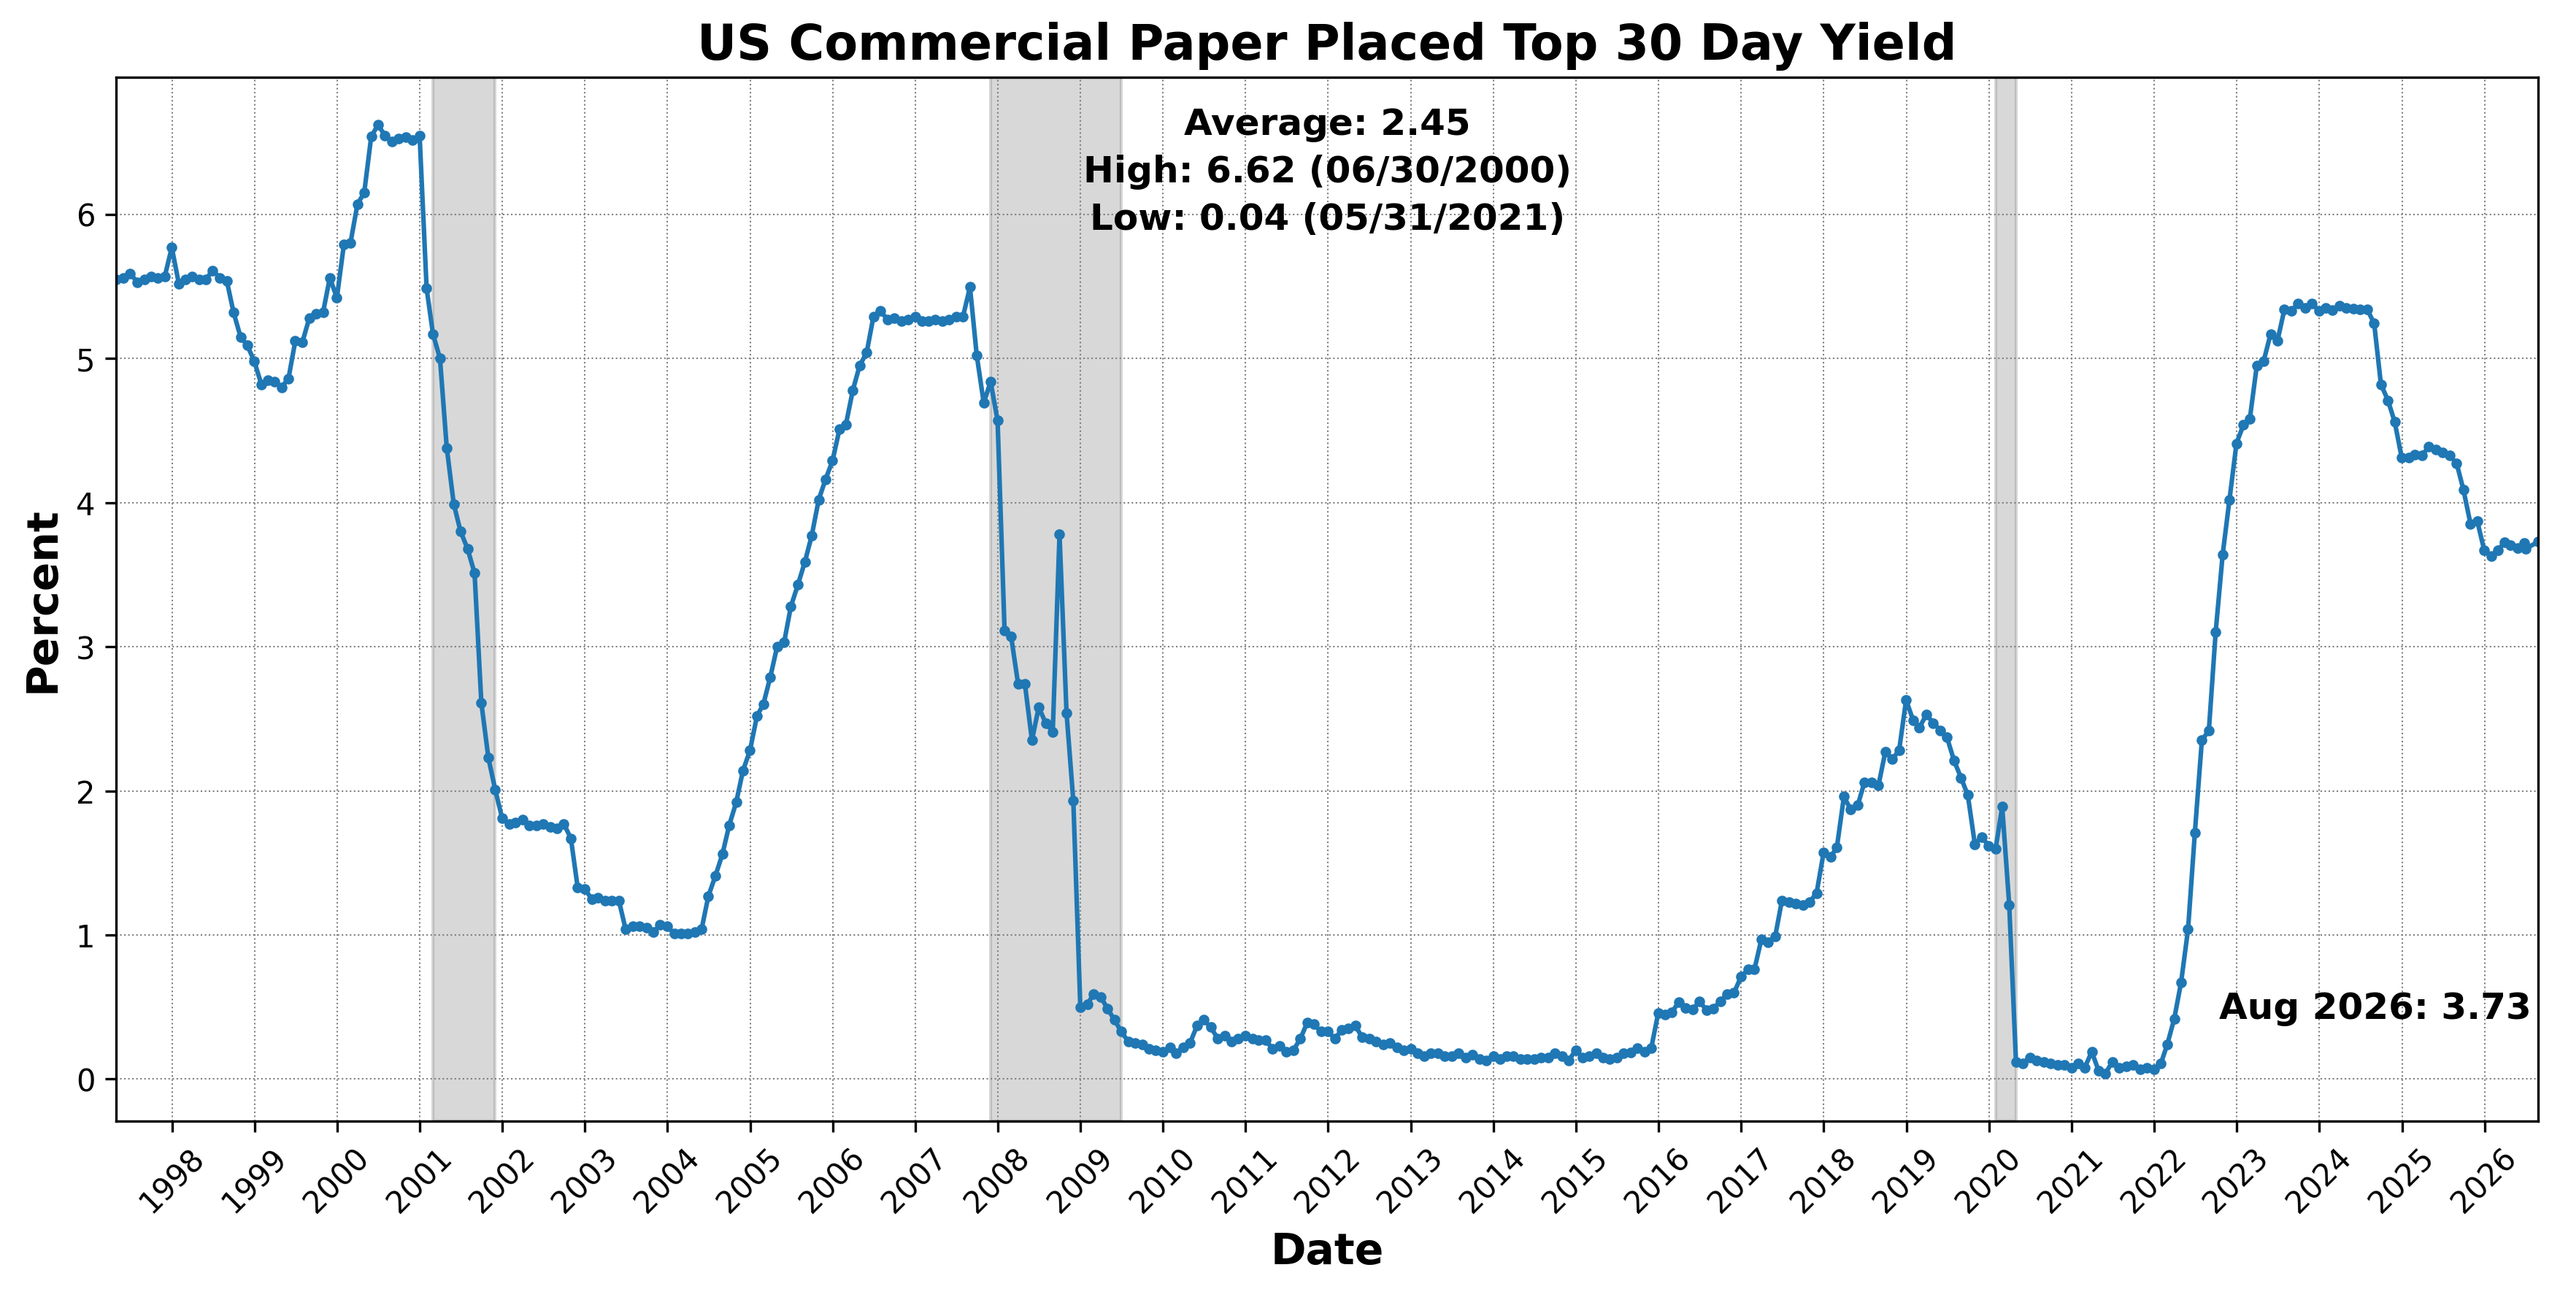
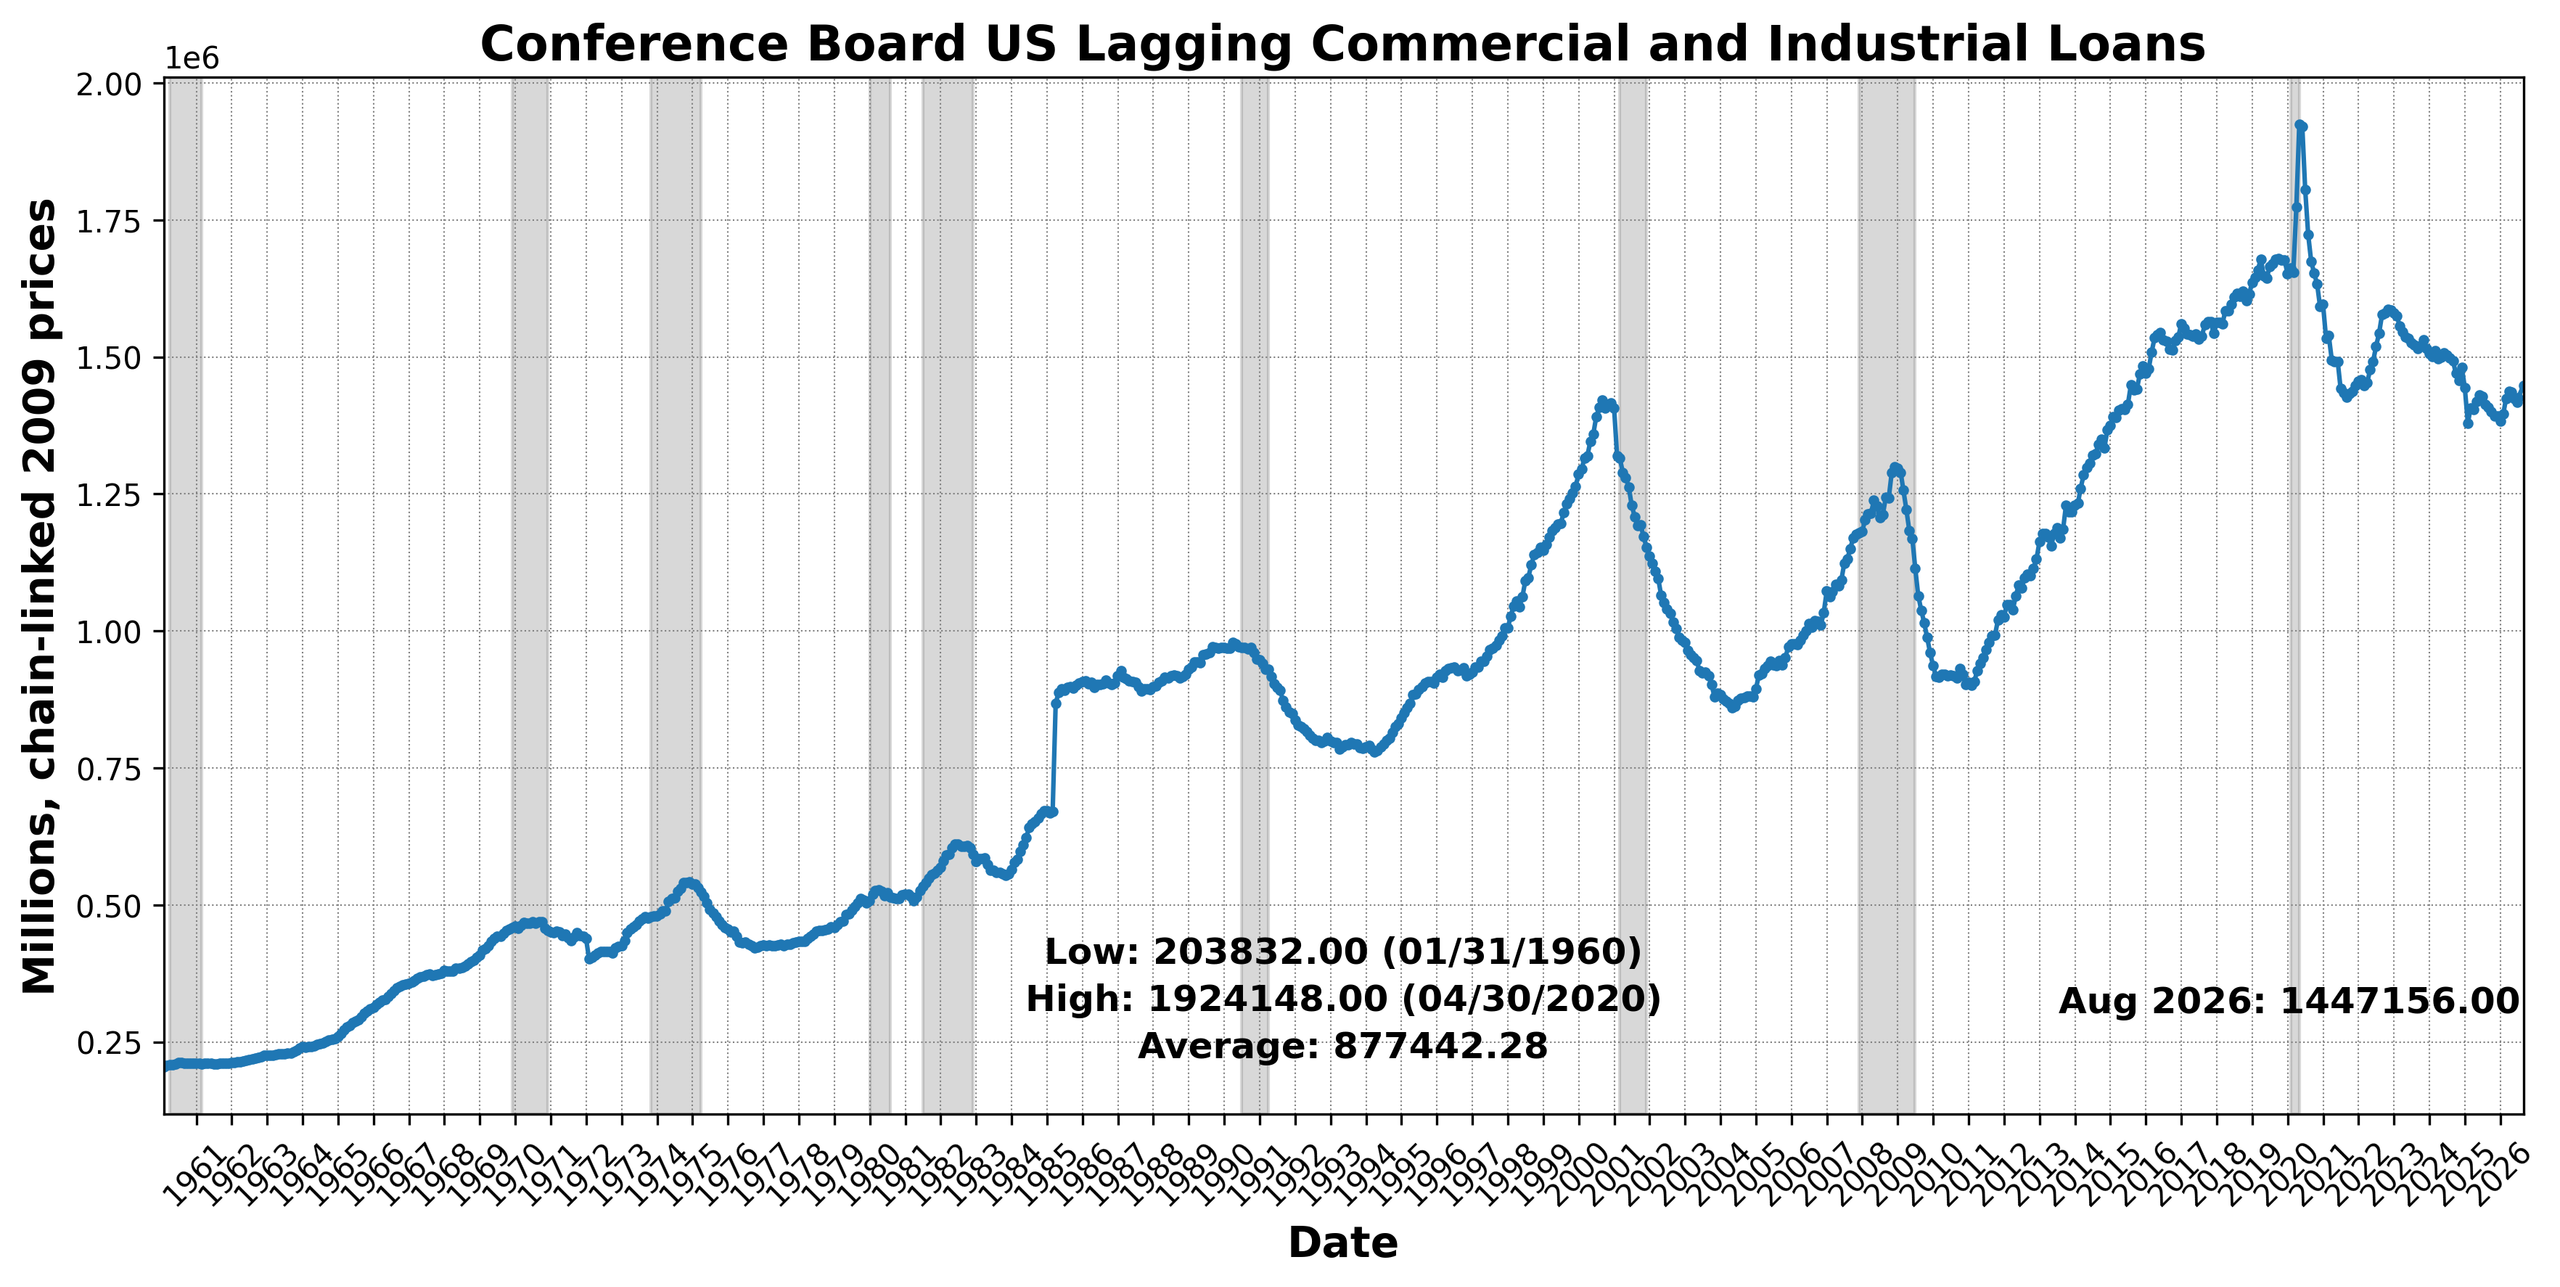
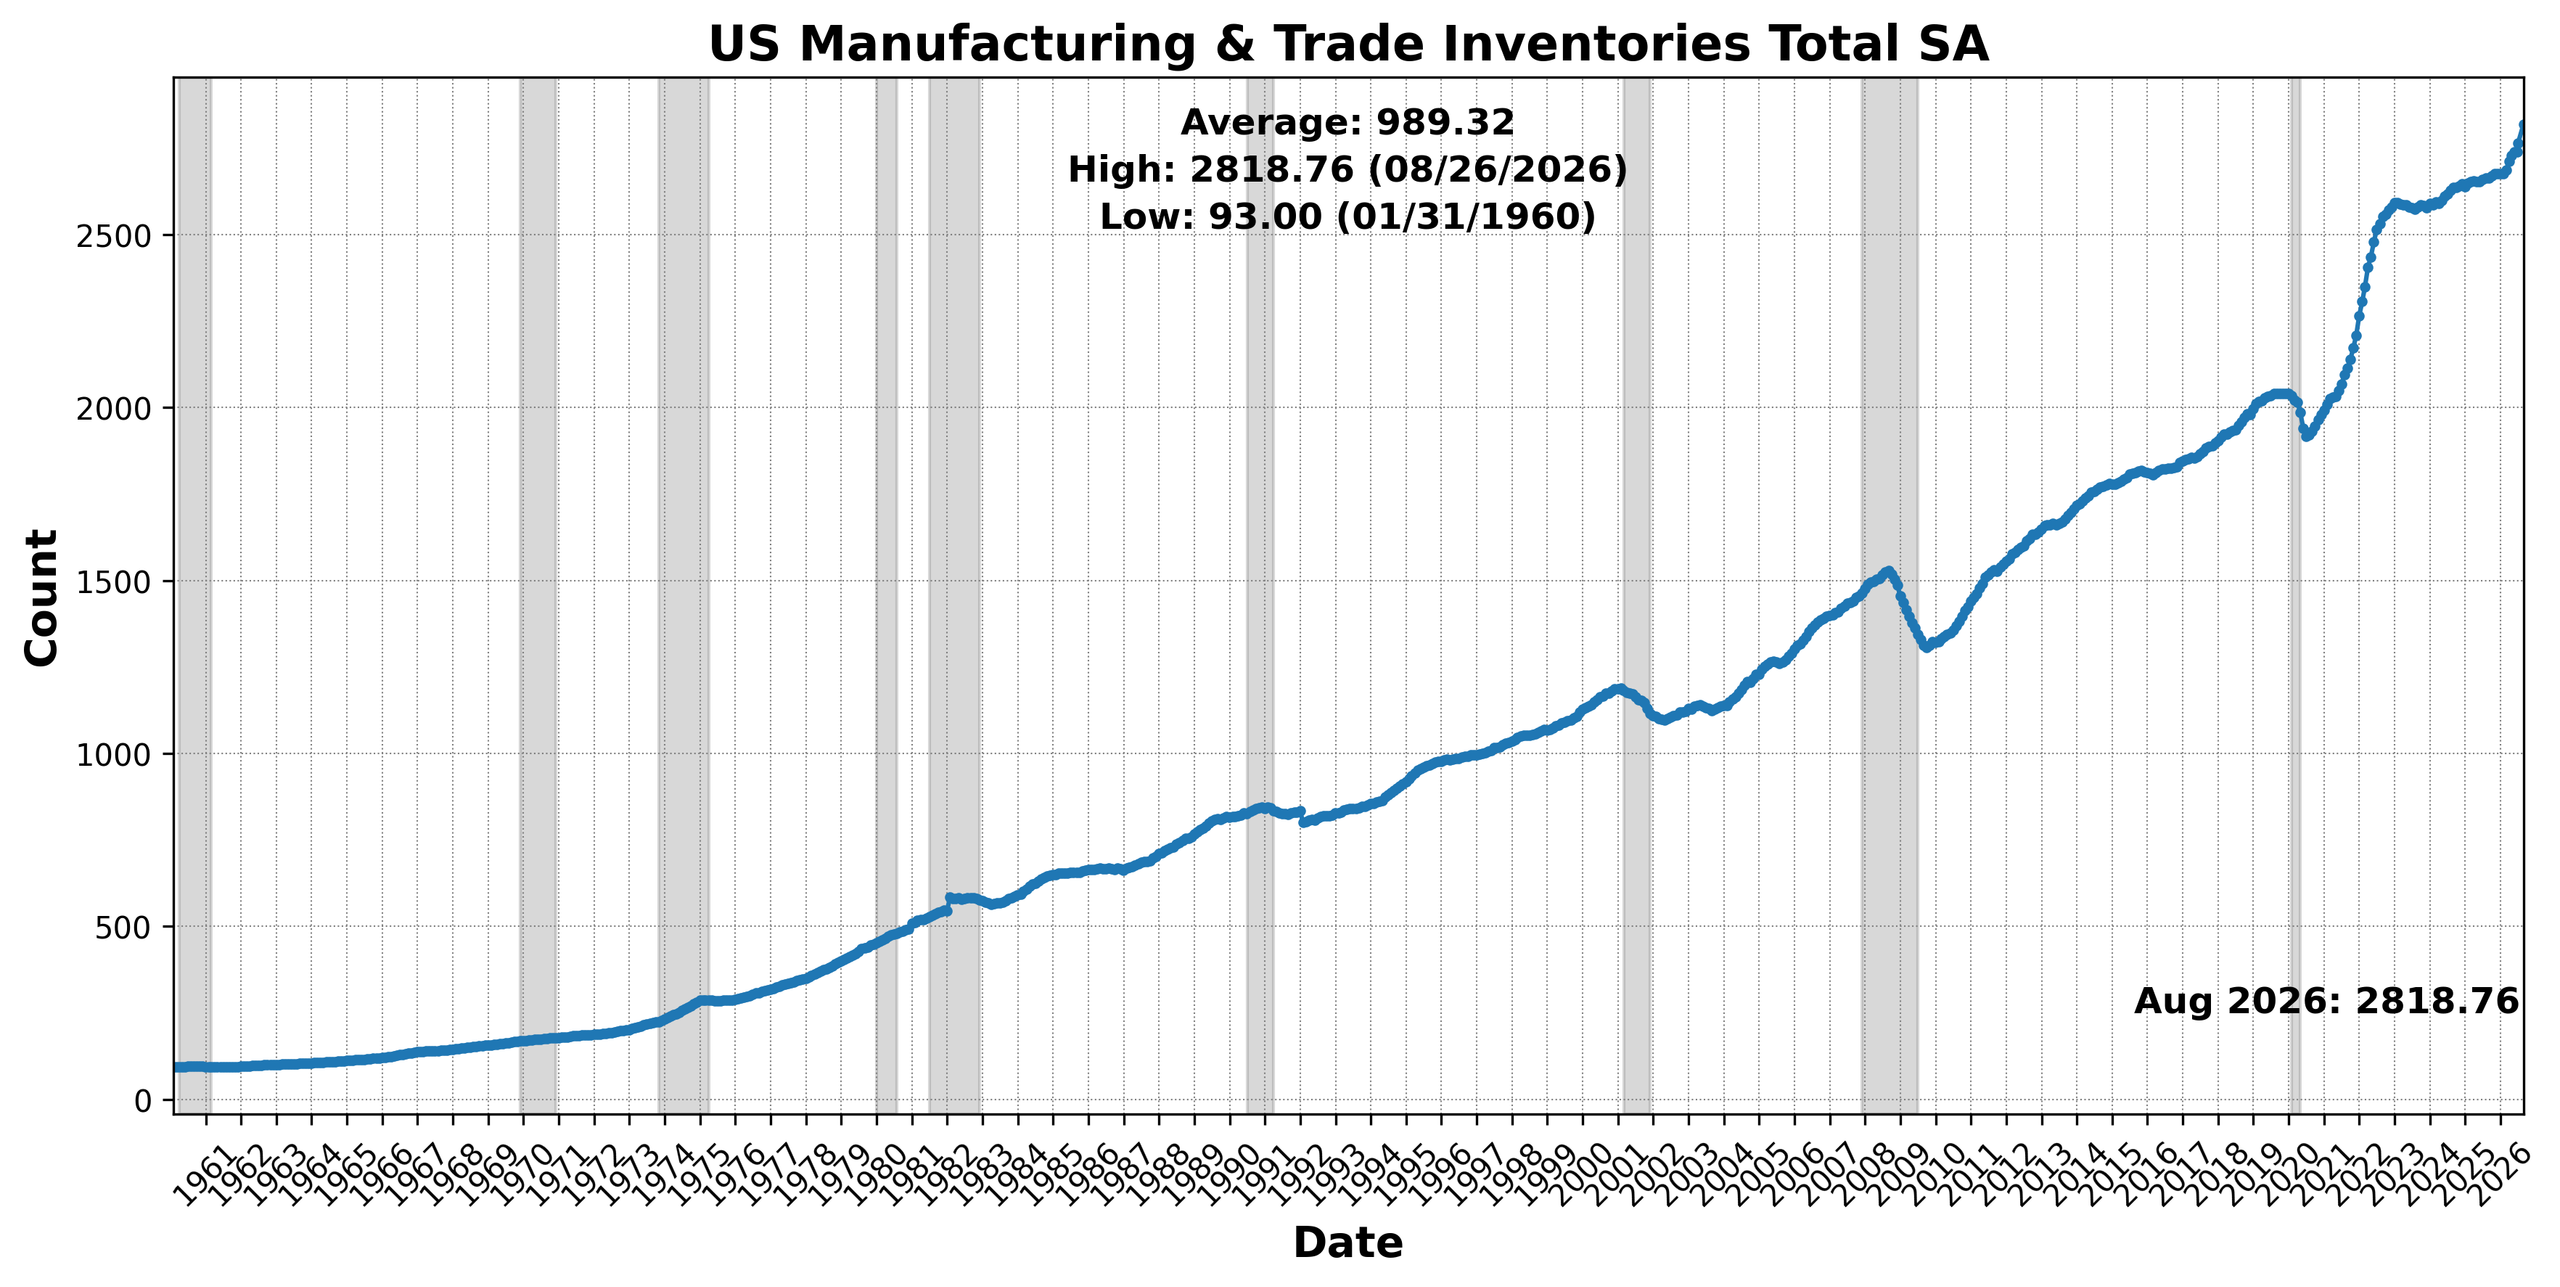
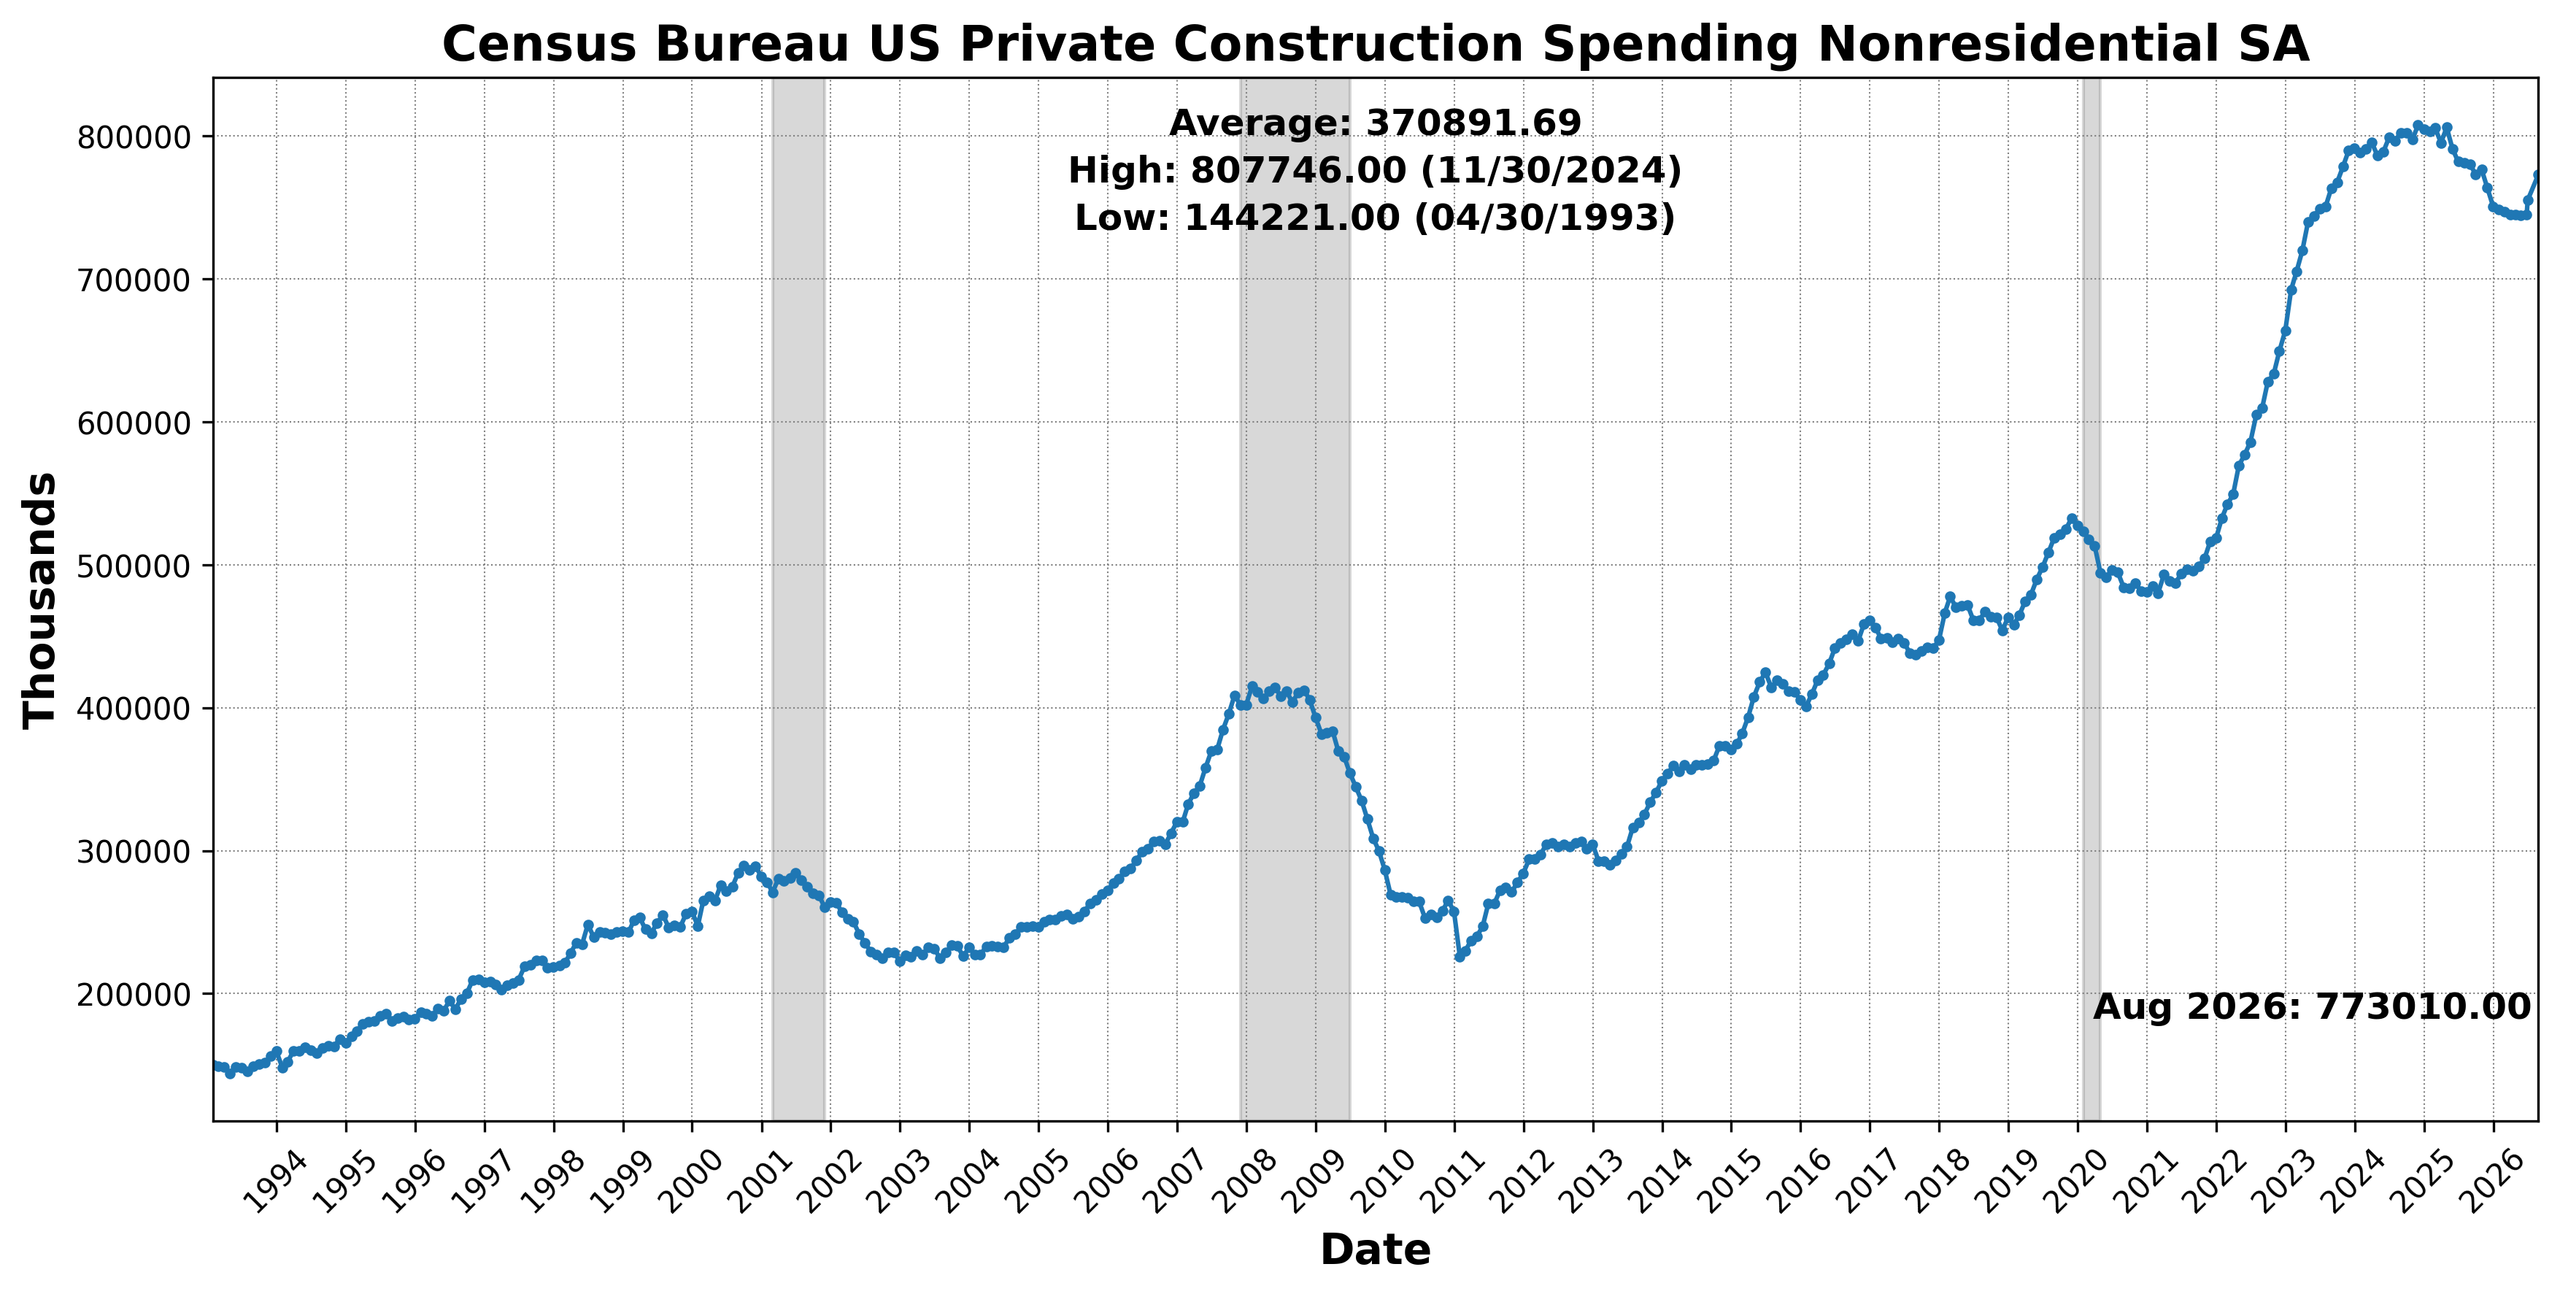
Conference Board US Lagging Commercial and Industrial Loans increased 1.4 percent, while US Manufacturing and Trade Inventories Total SA rose 0.4 percent. Census Bureau US Private Construction Spending Nonresidential SA advanced approximately 1.0 percent. Together, these measures indicate continued growth in commercial lending, inventories, and nonresidential construction spending. US Commercial Paper Placed Top 30 Day Yield increased 1.3 percent, supplying the fourth positive contribution under the BCM’s scoring framework.
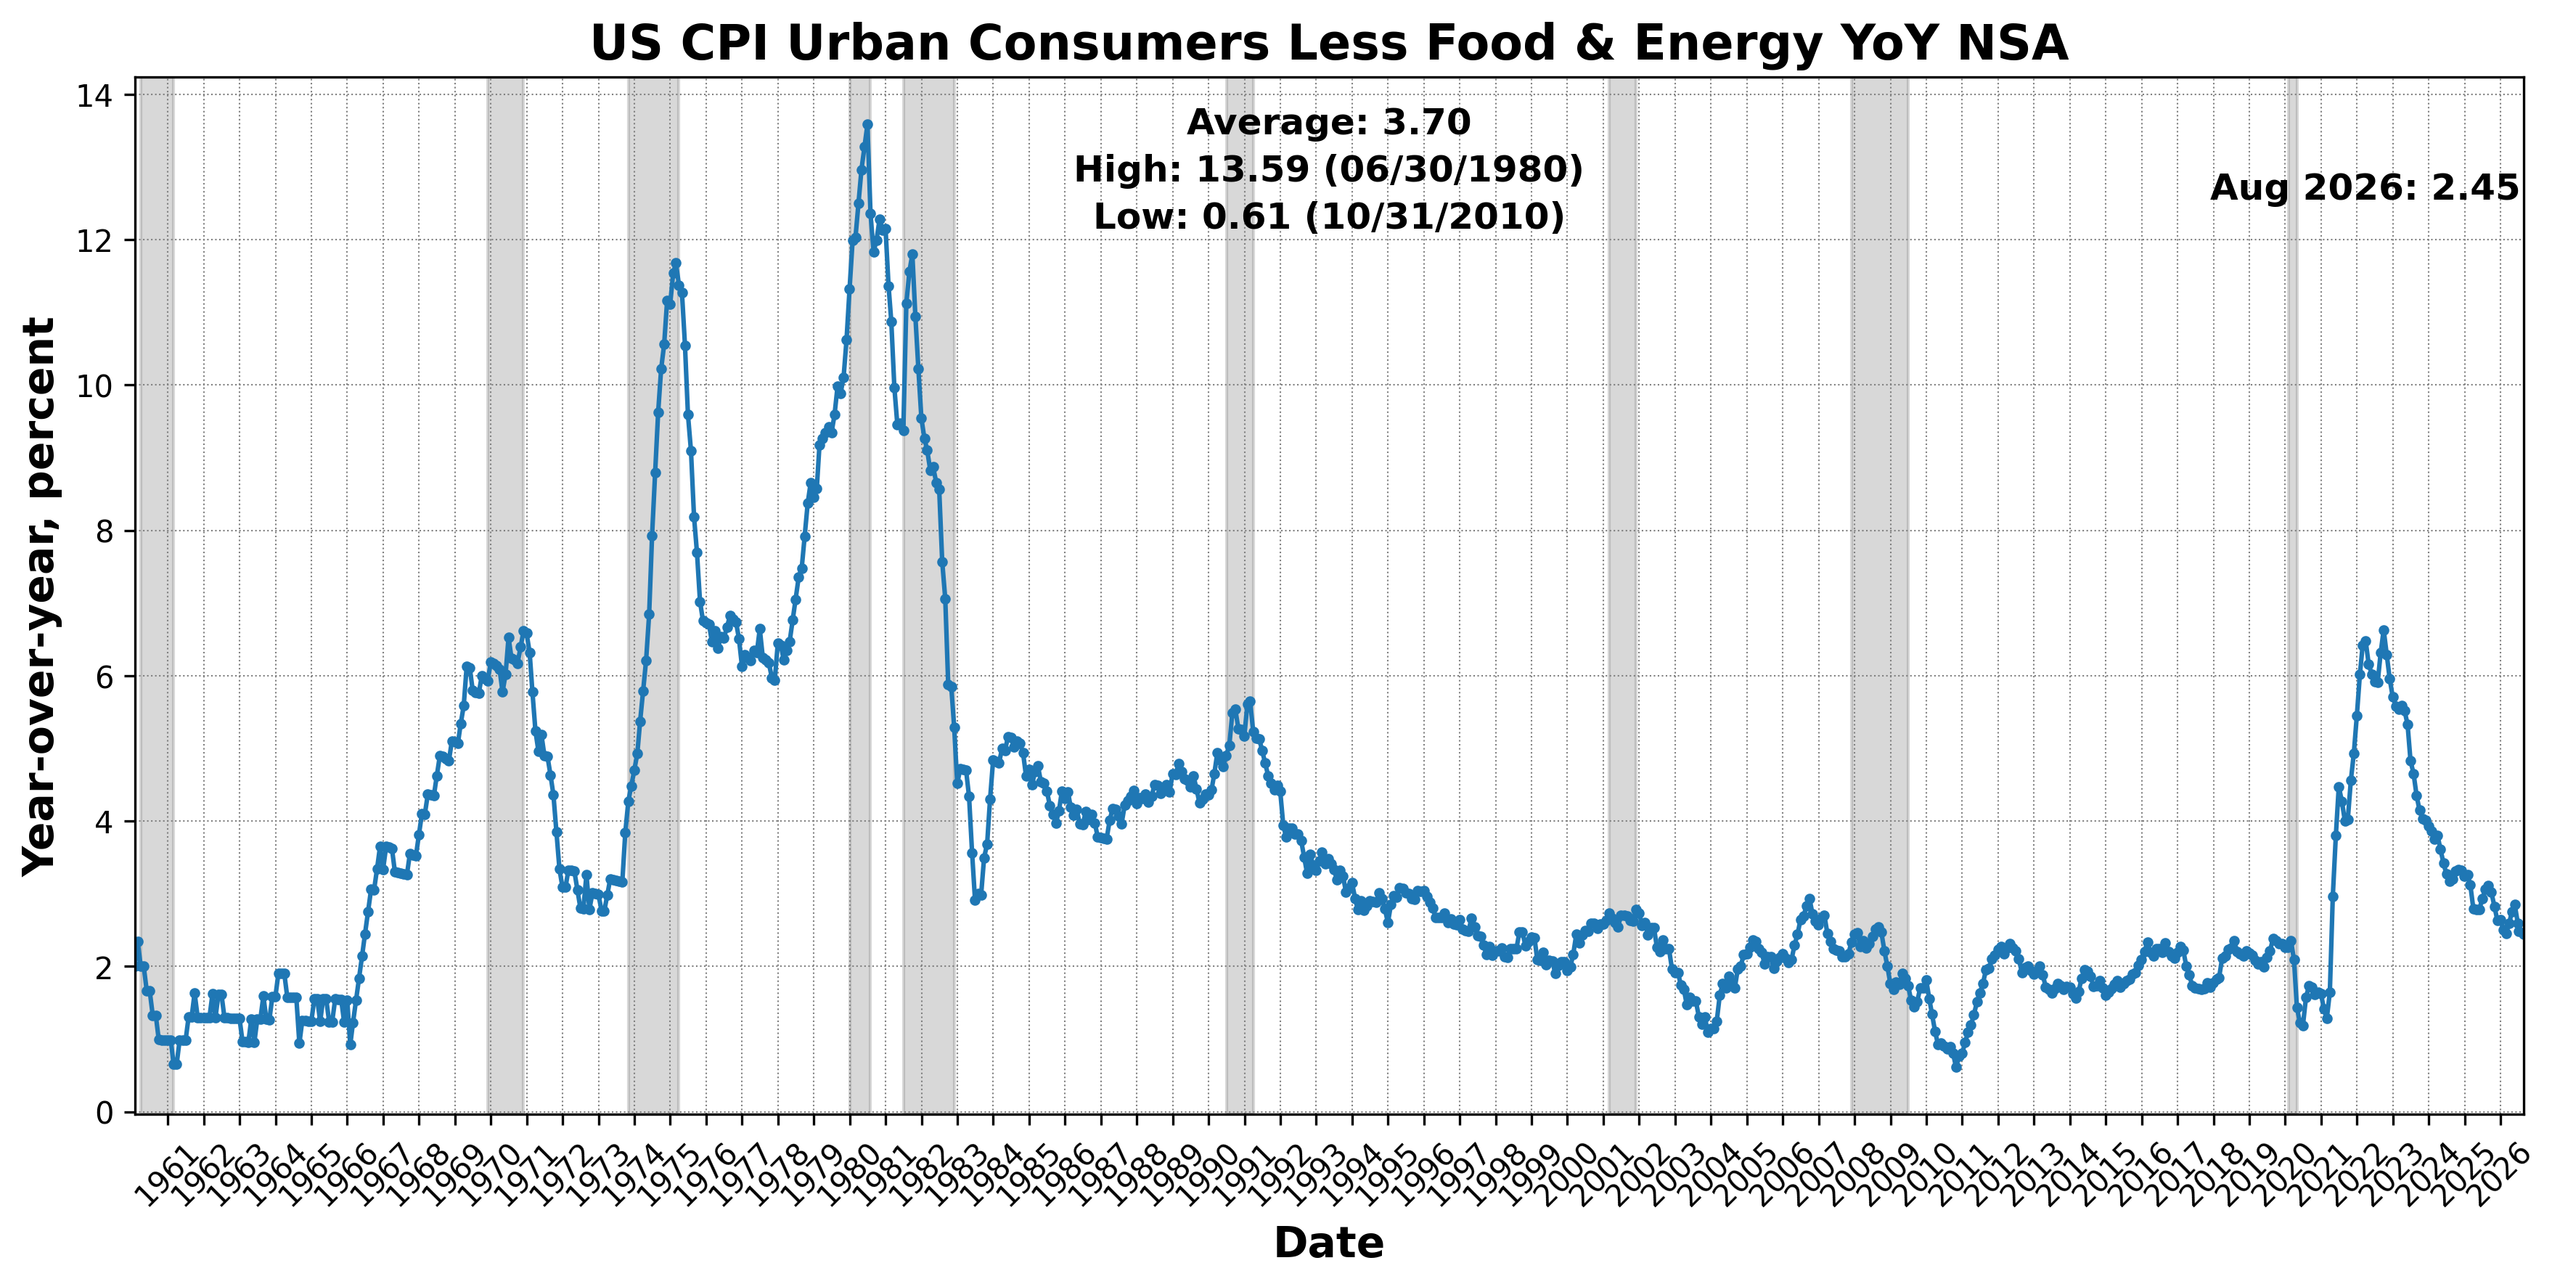
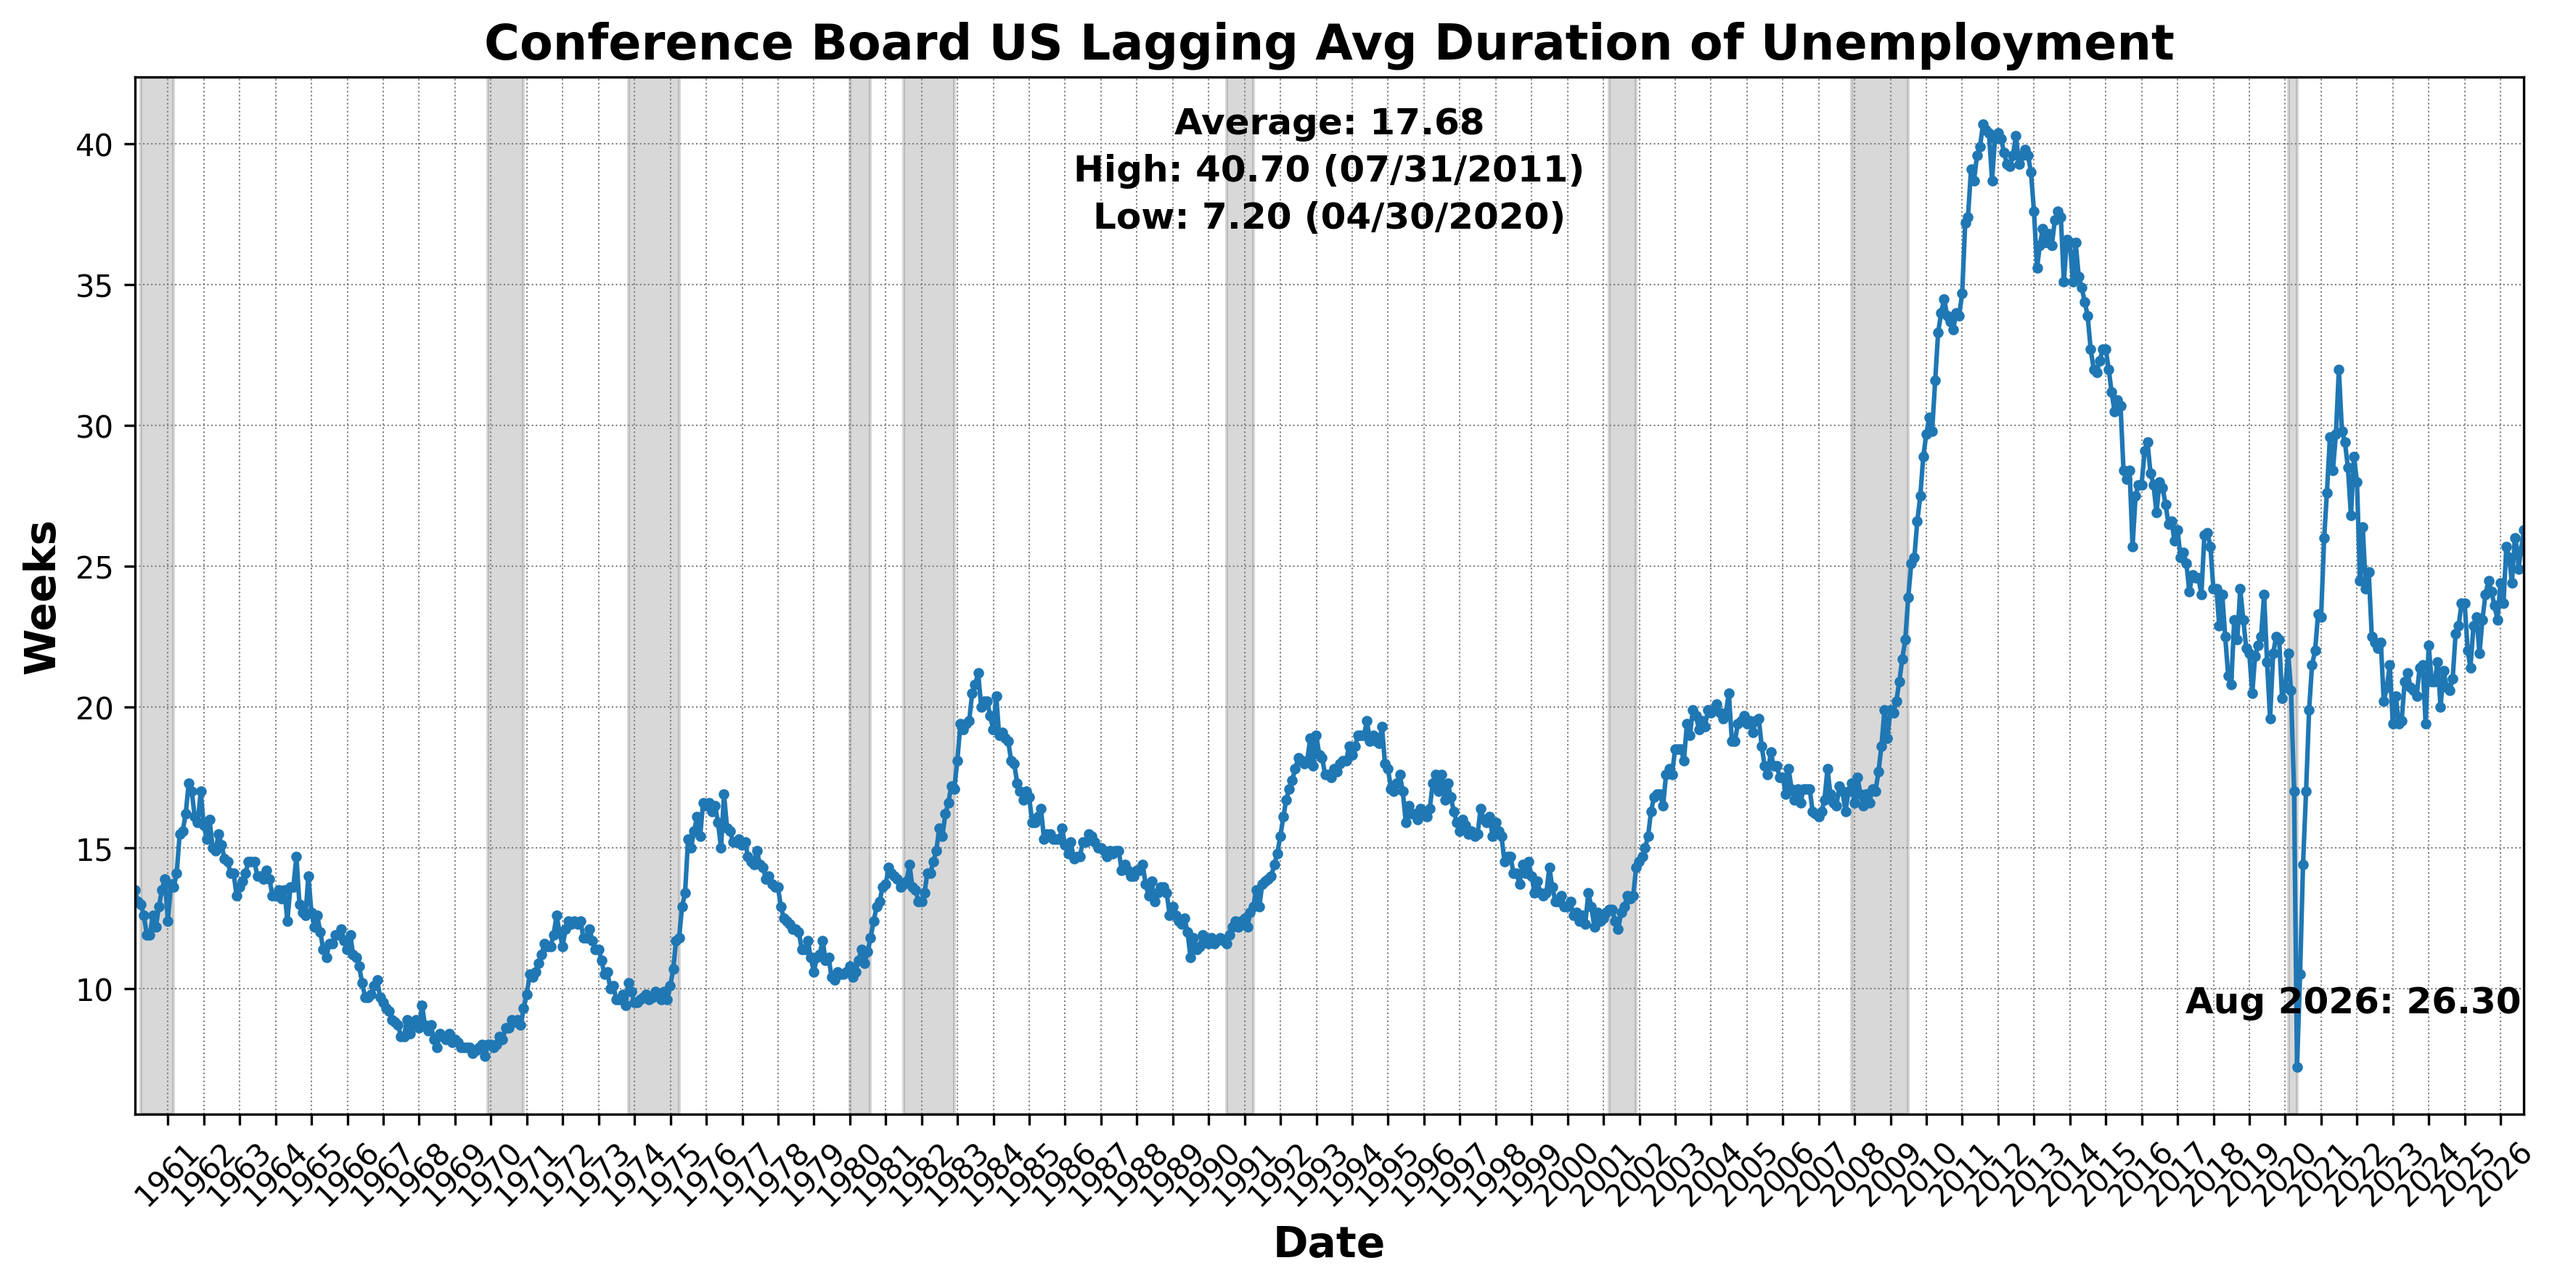
Labor market duration moved in the opposite direction. Conference Board US Lagging Average Duration of Unemployment increased 5.6 percent, from 24.9 weeks to 26.3 weeks. The longer average duration suggests greater difficulty finding work among those remaining unemployed and reversed July’s favorable movement. The year-over-year core CPI measure eased from approximately 2.48 percent to 2.45 percent. That was a 1.3 percent relative decrease in the reported inflation rate—not a monthly decline in the price level—and contributed negatively under the index’s established scoring convention. This arithmetic treatment should not be read as a judgment that lower inflation is economically undesirable.
The unchanged lagging reading thus masks offsetting developments. Commercial paper yields switched to a positive contribution, while average unemployment duration switched to a negative one. Lending, inventories, and nonresidential construction continued to support the index. These results describe established or slower-moving conditions, however, and do not resolve the uncertainty evident in the leading components.
In summary: August’s BCM readings narrow, but do not eliminate, the divergence between current activity and the outlook. The Leading Indicator’s recovery to neutral reduces some of the concern generated by July’s decline, while the Roughly Coincident Indicator shows a substantially broader set of advancing components. Continued weakness in housing and heavy truck sales, renewed deterioration in consumer expectations, and higher initial claims nevertheless argue against interpreting August as an unqualified strengthening. The most defensible conclusion is that current conditions improved while evidence of sustained future momentum remained mixed; subsequent readings will need to show whether the leading recovery broadens beyond an even split.
DISCUSSION (September–October 2026):
September’s inflation reports revealed renewed price pressure, largely associated with energy, after revisions had substantially improved the picture of underlying inflation over the summer. Consumer prices rose 0.65 percent during the month, with energy contributing 39 basis points, while producer prices jumped 1.3 percent as fuel costs worked through transportation and distribution. Annual headline CPI inflation reached 3.7 percent, and annual PPI inflation climbed to 6.3 percent. The increase was uneven: food prices were flat, medical commodities declined, and shelter accounted for much of the increase in core consumer prices. Owners’ equivalent rent rose 0.35 percent, contributing 12 basis points to the 0.33 percent core CPI increase. Although three-month annualized core CPI accelerated to 3.4 percent, the share of components rising faster than 3 percent declined on both six- and twelve-month measures.
Price pressure was more pronounced upstream. Transportation and warehousing prices increased 3.4 percent, trucking costs stood 15.4 percent above their year-earlier level, and trade margins expanded 1.4 percent. A sharp increase in producer airfares also pointed toward stronger September PCE inflation. At the same time, revisions to the PCE index lowered estimated three-month annualized core inflation to 2.0 percent in August, indicating that inflation entered September with less momentum than previously reported. The question now is whether higher energy and freight costs spread persistently across other prices. September supplied evidence of that risk, but falling inflation breadth and subdued readings in several categories leave a generalized resurgence unconfirmed.
The labor market is becoming more difficult for jobseekers even as employers show little inclination to dismiss existing workers. August job openings fell to 7.08 million from 7.34 million, leaving approximately one vacancy per unemployed person. Establishments with fewer than ten employees accounted for a particularly large share of the decline, with openings falling by 335,000. Professional and business services, education and healthcare, manufacturing, and construction also advertised fewer positions. Hiring nevertheless increased modestly to 5.19 million, layoffs declined to 1.64 million, and the quits rate remained at 1.9 percent. The adjustment is occurring primarily through fewer opportunities to enter or change jobs rather than widespread displacement.
September’s payroll report showed how weak job creation has become. Employers added just 29,000 positions following a downwardly revised 133,000 increase in August, bringing the three-month average to 51,000, roughly one-third of its spring pace. Private employment increased 46,000, partly offset by government reductions. Leisure and hospitality added only 10,000 jobs, healthcare hiring fell well below its twelve-month average, and local government education lost positions. Information, financial activities, and professional and business services also contracted, although construction, manufacturing, and transportation-related employment provided some support. The household survey recorded 406,000 additional employed people, but labor-force growth of 485,000 lifted unemployment to 4.2 percent. Average hourly earnings rose just 0.1 percent. The principal vulnerability is thus the economy’s limited capacity to absorb additional workers: layoffs remain contained, but slower hiring leaves households increasingly dependent on retaining their existing jobs.
September’s business surveys showed continued expansion in manufacturing and services, accompanied by increasingly widespread input-cost pressures. The ISM Manufacturing PMI slipped to 54.5, but new orders rose to 55.3 and backlogs reached 56.4. Customers’ inventories fell further below levels manufacturers considered adequate, potentially supporting production in coming months, although some purchasing may have been brought forward to avoid anticipated price increases. Production remained expansionary at 56.7, and employment strengthened to 52.7. Supply conditions remained difficult: deliveries lengthened, capital-expenditure lead times reached 176 days, and the prices-paid index jumped to 77.9. Nearly 59 percent of manufacturers reported higher prices, compared with fewer than 3 percent reporting declines.
The ISM Services PMI eased to 54.9 from 55.4, with thirteen industries reporting growth. New orders remained strong at 59.8, and backlogs increased to 56.6, their highest reading since July 2022. Business activity moderated but remained expansionary at 56.5, while employment edged above the growth threshold to 50.1 after two months of contraction. The services prices-paid index reached 74.0, with seventeen industries reporting increases and none reporting declines. Fuel and tariffs were prominent supply-chain concerns, and some respondents reported buying inventory ahead of expected price increases. Both surveys therefore point to enough work to sustain near-term activity, but also to costs that may squeeze margins or eventually reach customers.
Confidence has weakened among households and small businesses, although neither group’s assessment points uniformly toward contraction. The Conference Board’s consumer confidence index fell to 81.9 in September from 88.6, with the present-situation measure declining to 109.3 and the expectations index dropping to 63.6. Consumers saw fewer employment opportunities: 23.6 percent described jobs as plentiful, while 21.9 percent said they were hard to obtain, narrowing the difference to just 1.7 percentage points. Average year-ahead inflation expectations rose to 6.1 percent and the median reached 5.1 percent, both up 0.3 percentage point. During a survey period that included the Federal Reserve’s September rate increase, 68.4 percent of respondents anticipated higher interest rates over the following year. Households nevertheless remained positive on balance about income growth and stock prices. The University of Michigan’s preliminary October survey showed similarly depressed sentiment at 46.3, with year-ahead inflation expectations at 4.7 percent and longer-term expectations at 3.5 percent.
Small business owners are also less willing to commit to expansion. September’s NFIB optimism index slipped to 97.9, just below its historical average, while uncertainty rose to 90 against a long-run average of 68. Expectations for improved business conditions declined for a second month, fewer owners considered it a favorable time to expand, capital-spending plans retreated, and credit expectations weakened. Sales expectations nevertheless improved, and only 11 percent of respondents identified poor sales as their principal problem. Labor quality remained the leading concern, cited by 26 percent, while inflation rose to 20 percent. With 31 percent planning to raise selling prices over the next three months, cost pressures documented in the business surveys have a plausible route to household budgets.
Household caution is particularly evident in purchases that require substantial financing. September light-vehicle sales fell to a 15.98 million annualized pace from 16.76 million, their weakest reading since April. One month does not establish a sustained retreat, but the decline is consistent with resistance to the combined cost of purchasing, financing, and operating a vehicle. Higher fuel bills can also leave less income available for monthly loan payments. These figures point to pressure on a major category of consumer spending, though they do not by themselves establish a broad decline in retail sales.
Housing provides another illustration of how borrowing costs can restrain activity despite continuing demand. Existing-home sales increased 1.5 percent in September to a 3.99 million annualized rate, following a downwardly revised 3.2 percent decline in August, and remained depressed. Financing conditions subsequently became more restrictive: the average thirty-year mortgage rate reached 7.49 percent in early October, rising roughly half a percentage point in three weeks. Annual median-price appreciation slowed to 1.6 percent, but available inventory remained at 4.8 months of sales, below the level generally associated with a balanced market. The typical time on the market lengthened to 33 days. Neither slower price growth nor limited supply has resolved the affordability problem, and surveyed home-buying conditions approached record lows.
Industrial output has held up better than housing and vehicle purchases, although September’s gains offer qualified evidence of stronger business investment. Industrial production increased 0.7 percent, with manufacturing recovering 0.3 percent after August’s decline. Consumer-goods output rose 0.7 percent, and most durable-goods industries expanded despite a reduction in motor-vehicle production. Nondurable manufacturing increased 0.4 percent, supported principally by food, chemicals, and energy products. Much of the headline gain came from outside factories: utilities output jumped 3.5 percent as unusually warm weather boosted electricity demand, while mining increased 0.2 percent, including a 0.8 percent rise in crude-oil extraction. Information-processing equipment output fell 0.9 percent after a 0.7 percent August decline; those two decreases warrant attention but do not establish a reversal in AI-related capital spending. Overall capacity utilization rose to 76.9 percent, and manufacturing utilization edged up to 75.9 percent, leaving room for additional production before firms need substantial new capacity.
The monetary outlook has shifted toward a pause, despite the preference for additional tightening recorded in September’s FOMC minutes. All nineteen participants supported that meeting’s quarter-point increase, most anticipated another hike before year-end, and almost all considered inflation risks tilted upward. Reports of rising costs and greater success passing them through to customers reinforced those concerns, while staff pushed the projected return to 2 percent inflation out to 2029. Subsequent releases, however, changed the balance of evidence: PCE revisions lowered measured inflation more than officials had anticipated, while weak September payroll growth and higher unemployment challenged the view that labor-market conditions had strengthened. Energy and input costs leave the inflation outlook unsettled, but softer underlying inflation estimates and slower hiring reduce the urgency of another increase. A hike at the October 27–28 meeting consequently appears unlikely, with unchanged rates through year-end the more plausible course unless incoming data show a renewed, sustained acceleration in inflation.
The latest Beige Book reinforces the case for waiting while illustrating why inflation risks remain difficult to dismiss. Four districts reported faster price increases, and all noted higher oil prices, with fuel and diesel expenses moving through supply chains alongside pressure from tariffs, insurance, and other commodities. Passing those costs to customers remained difficult: consumer-facing businesses reported resistance to further increases and responded with selective price adjustments, incentives, and less costly offerings, often at the expense of margins. Spending remained uneven and disproportionately supported by higher-income households, while most districts anticipated only modest growth. At the same time, five districts described firms using AI and automation to reduce staffing needs through attrition, postpone hiring, or expand production without proportionate additions to payrolls. One contact reported both lower unit costs and greater output capacity. These accounts remain preliminary, but they suggest that some hiring restraint may reflect improved efficiency alongside cautious demand expectations.
The combined evidence suggests an economy that continues to expand, but in which sustained business activity coexists with weak hiring, strained affordability, and greater reluctance to make major financial commitments. Manufacturing and services retain substantial orders, while households face fewer job opportunities and borrowing costs that are restraining housing and vehicle purchases. Renewed energy and input-price pressures complicate the inflation outlook, although narrower inflation breadth and downward revisions to earlier readings leave a broad resurgence unconfirmed. The combination favors a Federal Reserve pause. Looking ahead, the durability of the expansion will depend on whether income and productivity gains can offset rising costs before cautious hiring and investment give way to a more general weakening in demand.
LEADING INDICATORS
ROUGHLY COINCIDENT INDICATORS
LAGGING INDICATORS
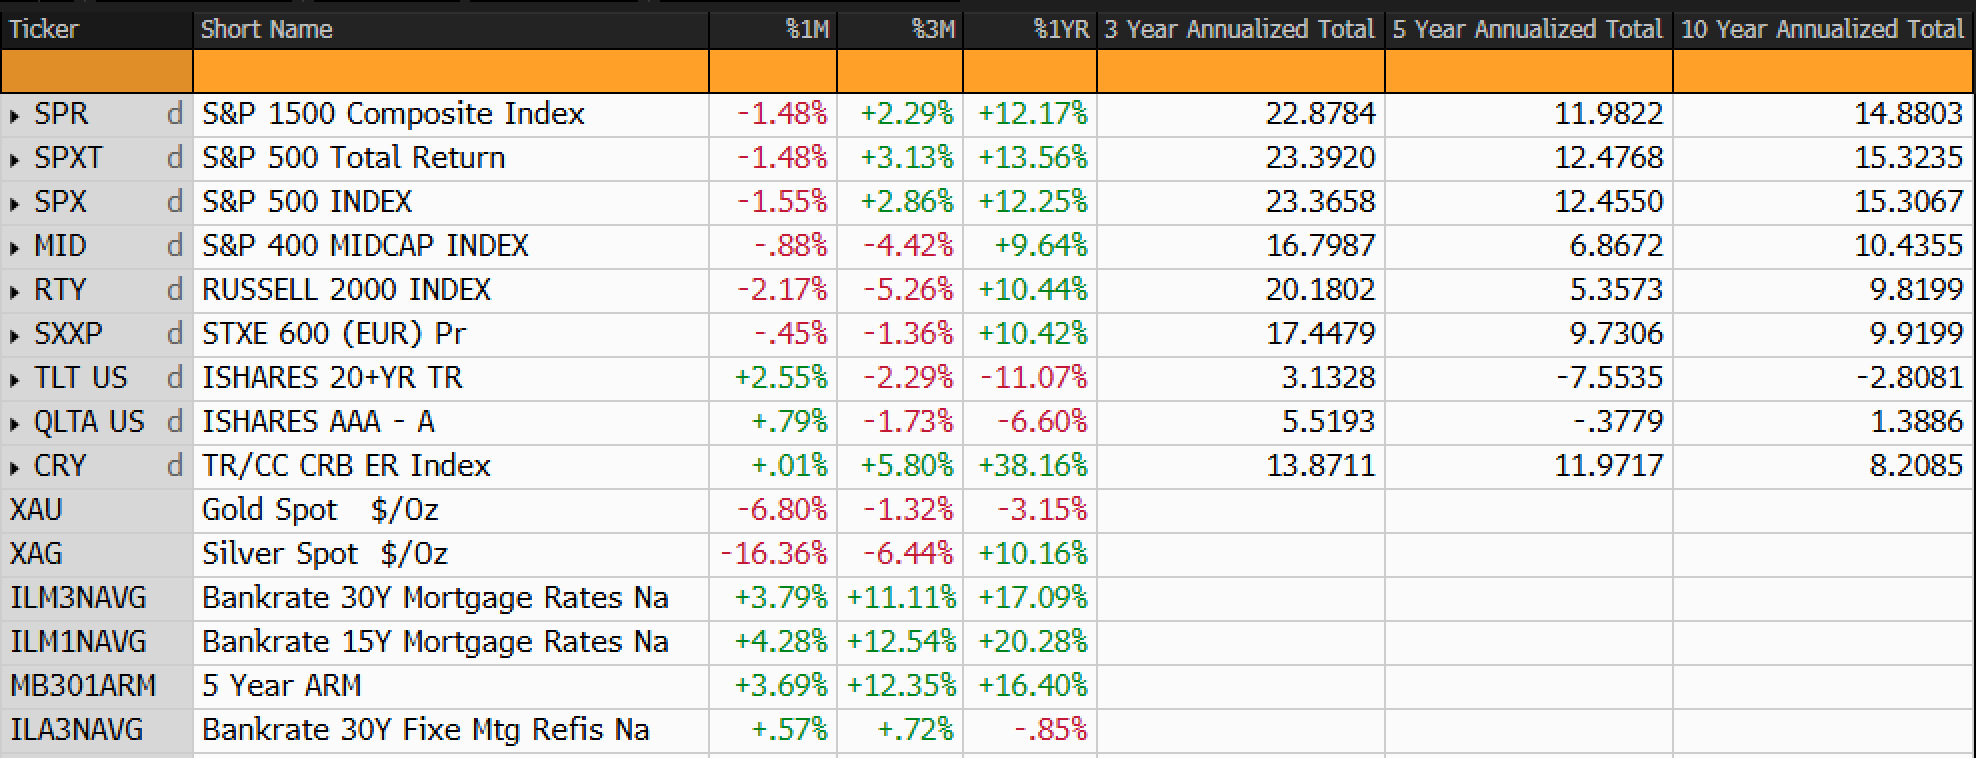
CAPITAL MARKET PERFORMANCE
To maintain consistency in the preparation and presentation of the AIER Business Conditions Monthly, portions of the report are completed with the assistance of artificial intelligence. All analysis, conclusions, and final editorial decisions are reviewed by AIER research staff.